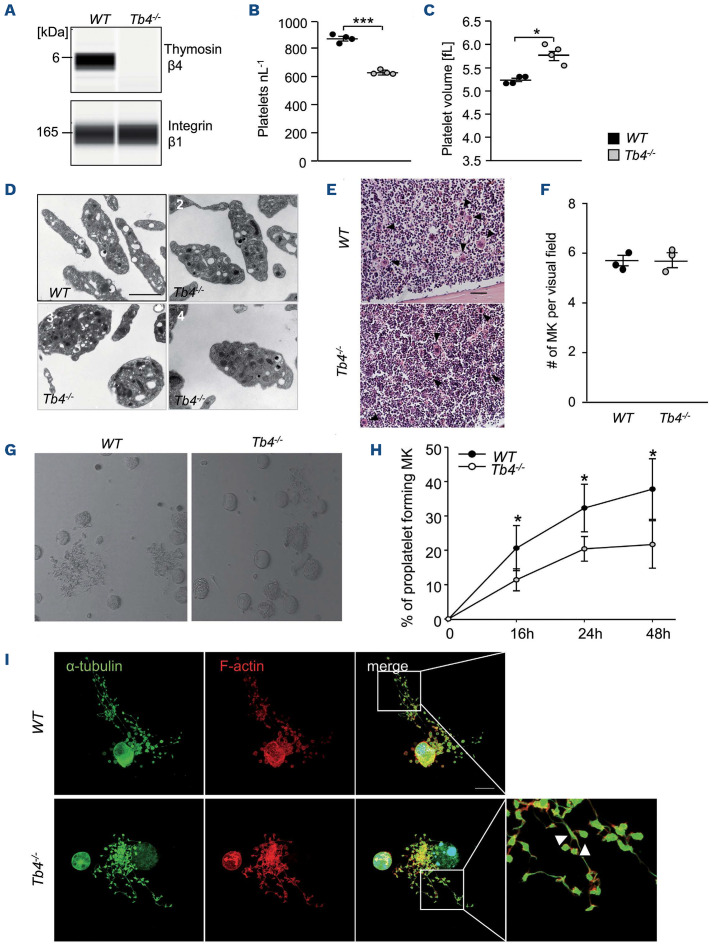
Figure 1.
Thrombocytopenia and impaired proplatelet formation in thymosin β4 knockout mice. (A) Protein levels of thymosin β4 and integrin β1 in wild-type (WT) and Tmsb4x knockout (KO) platelets were analyzed by an automated quantitative capillary-based immunoassay platform; Jess (ProteinSimple). Platelet count (B) and volume (C) were determined using an automated blood cell analyzer (ScilVet). Mean ± standard deviation (SD) (n= 4, 3 independent experiments). Unpaired, two-tailed Student’s t-test. ***P<0.001. (D) Representative transmission electron microscopic images of 1 WT mouse and 3 Tmsb4x KO mice: (2) platelets comparable to WT size, (3) big roundish platelets, (4) platelets with increased size. Scale bars: 2 mm. (E and F) Hematoxylin-eosin stainings of femur paraffin sections of WT and Tmsb4x KO mice (E) and quantification of megakaryocyte (MK) numbers (F). Arrow heads indicate the MK. Scale bars: 100 mm. Values are mean ± SD (n=3). (G and H) Proplatelet formation of bone marrow MK after lineage depletion and culturing in rHirudin- and TPO-conditioned medium. On day 4, proplatelet-forming MK were counted. Average of 5 analyzed visual fields per MK culture of 3 animals/genotype is shown. Values are mean ± SD. Unpaired, two-tailed Student’s t-test. *P<0.05. (I) Proplatelets were visualized using an α-tubulin antibody and phalloidin and analyzed by confocal microscopy (40x objective, Leica TCS SP8) using a 40x objective. Scale bar: 20 mm.

