Figure 2.
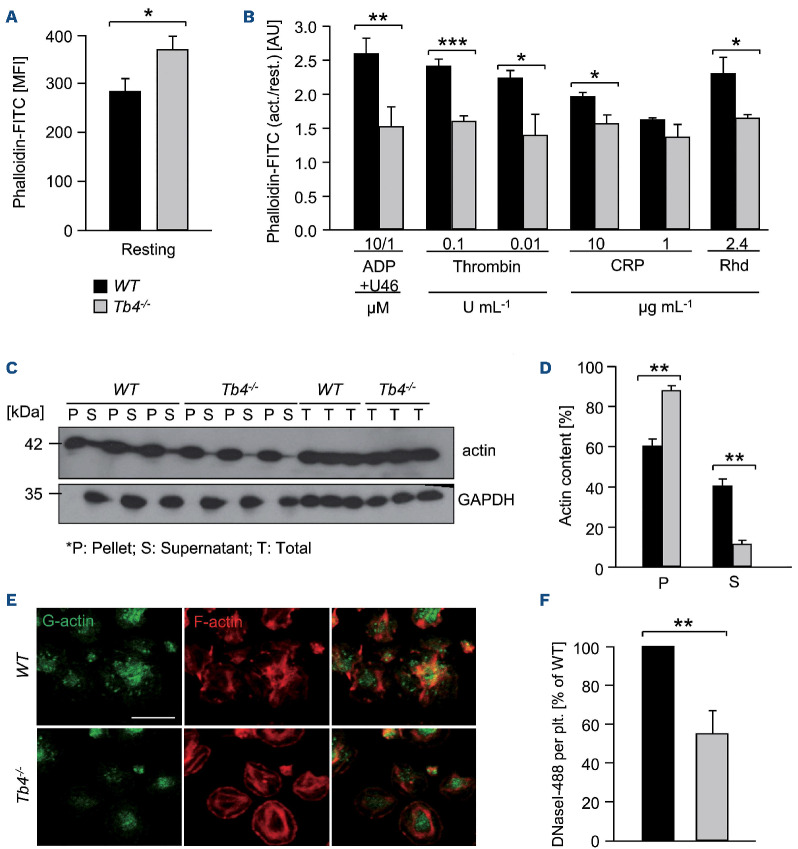
Impaired actin equilibrium and assembly in thymosin β4 knockout platelets. (A and B) Relative F-actin content of resting and activated platelets was determined by flow cytometry. Values are mean ± standard deviation (SD) of 4 mice per group. The values are displayed as the ratio of MFI: mean fluorescence intensity from activated and resting platelets. Unpaired, two-tailed Student’s t-test. *P<0.05, **P<0.005, ***P<0.001. (C and D) The actin cytoskeleton was isolated by ultracentrifugation, immunoblotted with an anti-β-actin antibody and analyzed for the content of monomeric vs. filamentous actin using densitometry. GAPDH served as loading control. Values are mean ± SD (n=3). P: pellet, S: supernatant, T: total protein. Unpaired, two-tailed Student’s t-test. **P<0.005. (E and F) Visualization of the cytoskeleton of spread platelets (15 minutes) on fibrinogen, which were stained with DNase I-AlexaF488 (green) to label G-actin and Phalloidin-atto647N (red) for visualization of F-actin and analyzed by confocal microscopy. Scale bar: 20 mm. Values are mean ± SD (n=3). Unpaired, two-tailed Student’s t-test. **P<0.005.

