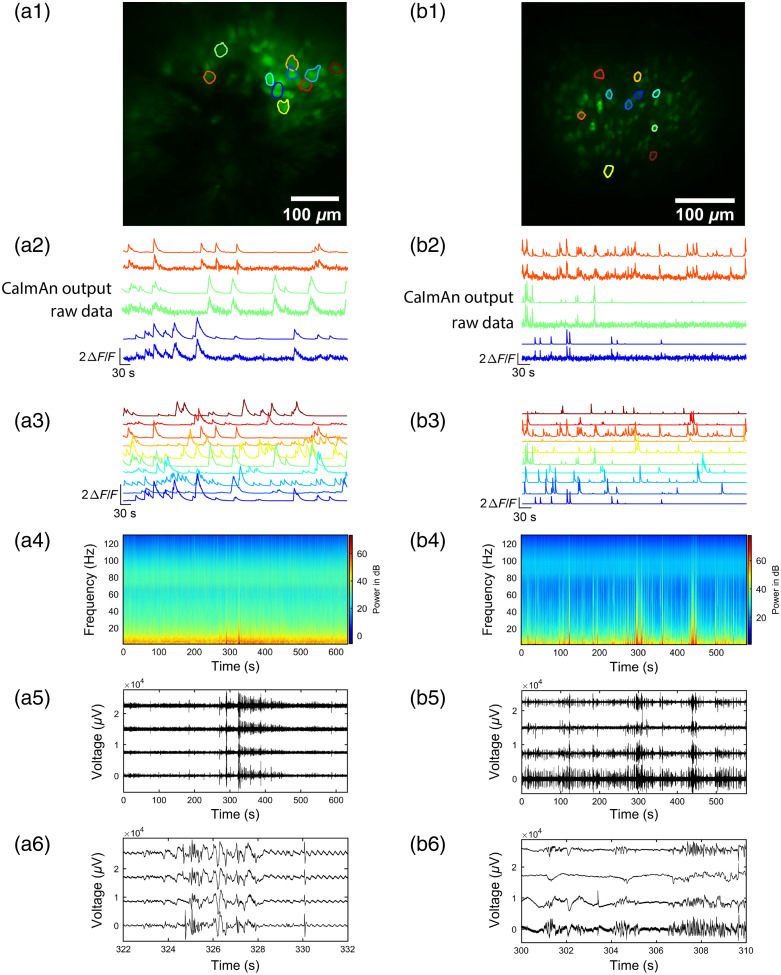
Fig. 3.
Example GRINtrode data recorded from head-fixed mice. (a1) Maximum intensity timelapse projection of GCaMP data from a 10-min recording session in a female Thy1xGCaMP6f mouse with viral expression of jGCaMP7f imaged with GRIN lens system A. The GRINtrode was implanted to dentate gyrus. Selected cell ROIs are outlined. (a2) traces of raw GCaMP imaging data versus CaImAn-processed data, color matched to ROIs of selected cells in panel (a1). (a3) CaImAn-processed traces of GCaMP fluorescence, color matched to ROIs in panel (a1). (a4) Power spectrogram of LFP activity, averaged over all 16 electrodes of the GRINtrode for the recording session. (a5) Raw electrode recordings selected from one electrode of each tetrode. (a6) Raw electrode recordings from the same electrodes shown in panel (a5) over a shorter time span of high LFP activity. (b1) Maximum intensity timelapse projection of GCaMP data from a 10-min recording session in a female Thy1xGCaMP6f mouse with viral expression of GCaMP6s imaged with GRIN lens system B. The GRINtrode was implanted to hippocampal layer CA1. Selected cell ROIs are outlined. (b2) traces of raw GCaMP imaging data versus CaImAn-processed data, color matched to ROIs of selected cells in panel (b1). (b3) CaImAn-processed traces of GCaMP fluorescence, color matched to ROIs in panel (b1). (b4) Power spectrogram of LFP activity, averaged over all 16 electrodes of the GRINtrode for the recording session. (b5) Raw electrode recordings selected from one electrode of each tetrode. (b6) Raw electrode recordings from the same electrodes shown in panel (b5) over a shorter time span of high LFP activity.

