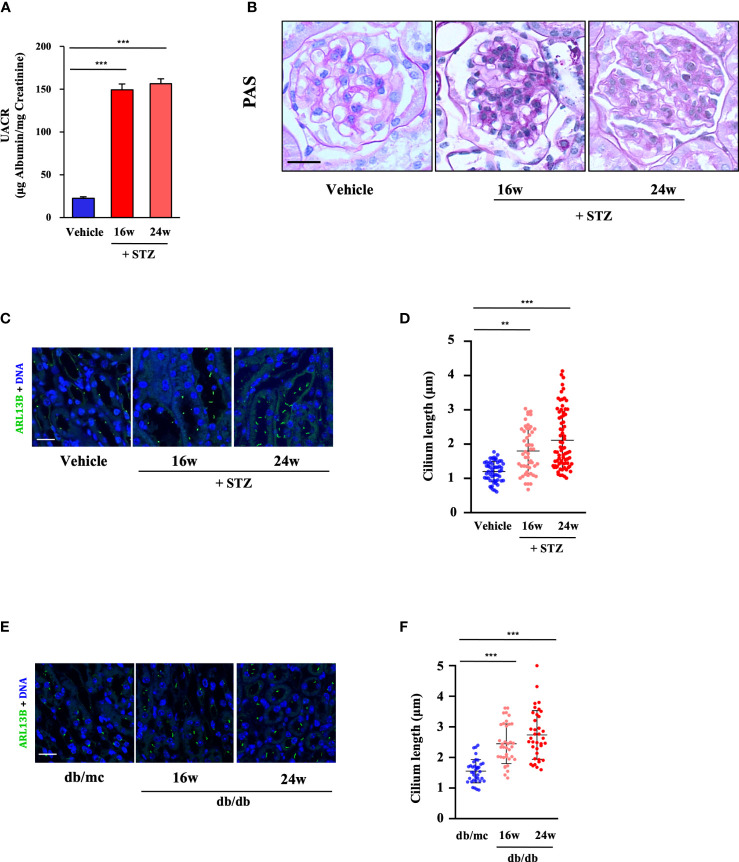
Figure 2.
Renal cilia were lengthened in two different diabetic mouse models. (A) Urinary albumin-to-creatinine ratio (UACR) at 0, 16, and 24 weeks post-STZ injection (four mice per group). (B) Kidney sections from STZ-induced diabetic mice at 0, 16, and 24 weeks post-STZ injection were stained with PAS. Scale bar, 20 μm. (C) Kidney sections from STZ-induced diabetic mice were stained for the ciliary marker ARL13B (green) and DNA (blue). Scale bar, 20 μm. (D) Quantification of the cilium length in (C) (four mice per group). (E) Kidney sections from db/db mice were stained for the ciliary marker ARL13B (green) and DNA (blue). Scale bar, 20 μm. (F) Quantification of the cilium length in (E) (four mice per group). Each dot represents one cell. The data are the means ± SD. One-way ANOVA was performed followed by Dunnett’s multiple comparisons. **P < 0.01; ***P < 0.001.

