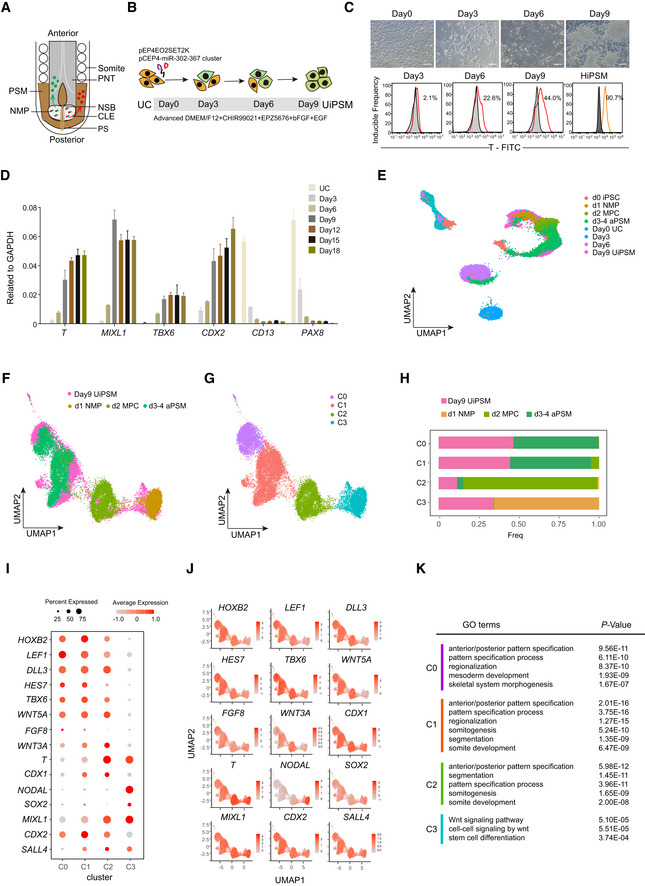
Schematic representation of the vertebrate embryonic central nervous system (CNS) indicating cell populations that give rise to the CNS. The posterior spinal cord arises from neuromesodermal progenitors (NMPs; red/green), which are located in the anterior primitive streak (PS; brown) and in the adjacent caudal lateral epiblast (CLE; light gray). NMPs give rise to new neural progenitors (NP; green), which contribute to the CLE (light gray) and then the preneural tube (PNT; dark gray), and to new mesoderm progenitors (MP; red), which contribute to presomitic mesoderm (PSM; brown), then give rise to somites.
Schematic overview of UiPSM reprogramming from UC. UC, human‐derived urine cells; UiPSM, presomitic mesoderm progenitor cells induced from human‐derived urine cells.
Representative images showing morphologic changes during UiPSM reprogramming (n = 3 independent experiments). Scale bars, 100 μm. Representative flow cytometry of T protein expression during UiPSM reprogramming, with hES‐derived HiPSM as a positive control (n = 3 independent experiments).
qRT–PCR analysis of PSM‐specific genes T, MIXL1, TBX6, and CDX2; and UC‐specific genes CD13 and PAX8 during the extended reprogramming time points, including days 0, 3, 6, 9, 12, 15, and 18. Data are mean ± s.d., n = 3 independent experiments.
UMAP analysis of 32,798 individual cells from UiPSM reprogramming on days 0, 3, 6, 9, and human iPSC differentiated PSM at d0 iPSC, d1 NMP, d2 MPC, and d3‐4 aPSM based on Margarete Diaz‐Cuadros
et al (
2020).
UMAP analysis of UiPSM on day 9 and published data (d1 NMP, d2 MPC, and d3‐4 aPSM) as in (E).
The cells in (F) are clustered and colored by the Louvain algorithm with four clusters.
Bar chart showing the proportion of UiPSM on day 9, d1 NMP, d2 MPC, and d3‐4 aPSM in each cluster.
Dot plot showing the expression level and ratio of PSM marker genes in four clusters.
Expression level of PSM marker genes in UMAP projection.
Gene ontology analyses of differentially expressed genes in four clusters with significantly enriched terms ranked by P‐value.

