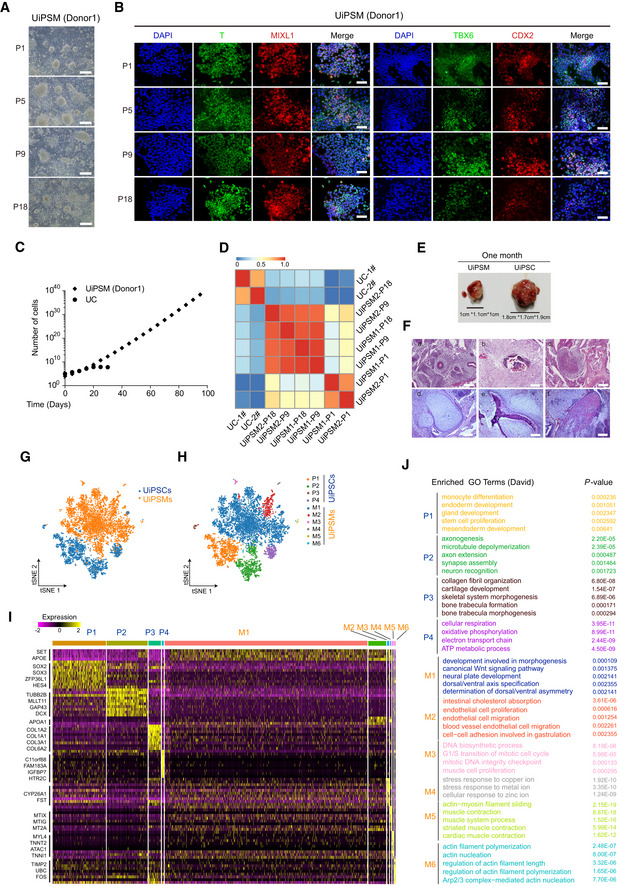
Representative images of UiPSM maintained in a defined medium (DM) at different passages. n = 4 biological experiments. Scale bars, 100 μm.
Immunofluorescence of DAPI, T, MIXL1, TBX6, and CDX2 in UiPSM colonies in (A). n = 4 biological experiments. Scale bars, 200 μm.
Growth curve of UCs and UiPSMs. Cells were seeded at 1 × 10⁵ cells/well (24‐well plate) and passaged every 5 days. Data were mean, n = 3 wells from three biological experiments.
Correlation analysis showing the similarity among UiPSM and the difference between UC and UiPSM. UiPSM1/2/3 derived from donor 1/2/3.
Representative images of UiPSM‐ and UiPSC‐derived teratomas at 1 month after transplantation. n = 3 biological experiments.
Representative images of HES‐stained UiPSM (d–f) and UiPSC (a–c)‐derived teratomas. (a) gland epithelium (endoderm); (b) osteoblast (mesoderm); (c) neural epithelium (ectoderm); (d) chondrocyte (mesoderm); (e) osteoblasts, osteoclasts, osteocytes (mesoderm); (f) muscle cell (ectoderm); n = 3 biological experiments. Scale bars, 100 μm.
t‐SNE projection of 12,456 individual cells from UiPSM and UiPSC teratomas.
t‐SNE projection in (G) colored by clusters identified with Louvain algorithm.
Representative marker expression shown in heatmap corresponding to each cluster in (G) and (H).
Gene ontology analyses for each cluster in (G) and (H). P‐value was < 0.05.

