-
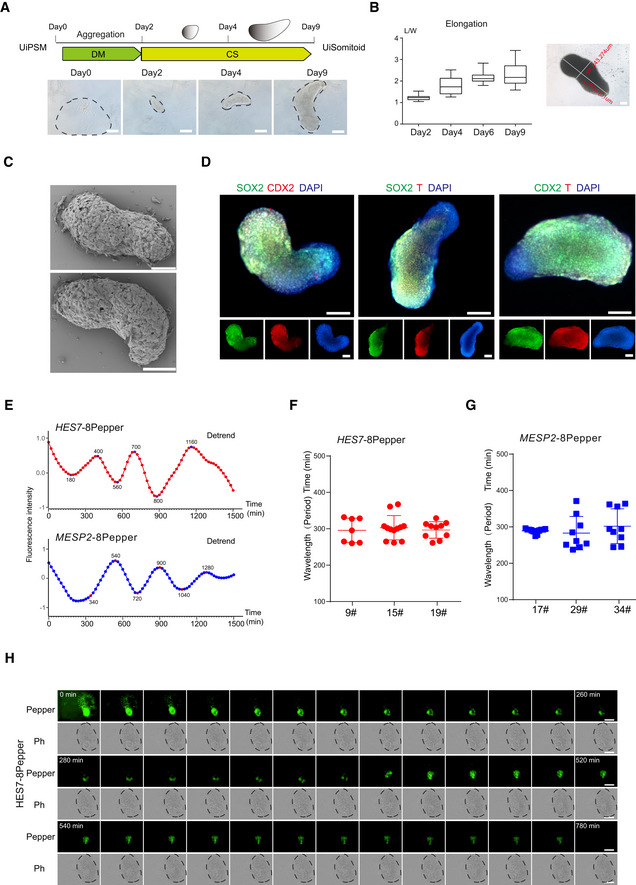
A
Schematic overview of UiSomitoid generation from UiPSM in a two‐stage process, CS (Advanced DMEM/F12 supplemented with 3 μM CHIR99021 and 5 μM SB431542) medium from day 2 to 9 after 2‐day aggregation in DM medium. Scale bars, 200 μm.
-
B
Representative images of UiSomitoids (n = 10 biological experiments). Scale bars, 100 μm. Detected the ratio of length (L) over width (W) axis in (A). Top to bottom on the box chart represents maximum value, 75th percentile, median, 25th percentile, and minimum value. Twenty‐four aggregates calculated in one experiment. n = 3 independent experiments. Scale bars, 100 μm.
-
C
Scanning electron micrographs of UiSomitoids on day 9. Two presentative examples were shown in two independent experiments (n = 24 UiSomitoids). Scale bars, 200 μm.
-
D
Immunofluorescence of SOX2 (green) co‐stained with T (red) or CDX2 (red), CDX2 (green) co‐stained with T (red) within UiSomitoids on day 9 (n = 4 biological experiments). Scale bars, 200 μm.
-
E
Representative quantification of HES7 and MESP2 mRNA–8pepper fluorescence intensity in a Uisomitoid (red and blue lines, n = 29 independent experiments for each plot).
-
F, G
Oscillatory HES7 (F) and MESP2 (G) reporter activity measured with Incucyte® S3 Live‐Cell Analysis System and calculated oscillation periods. Data are mean ± s.d. n = 7, 12, 10 independent experiments for HES7 and n = 11, 9, 9 independent experiments for MESP2.
-
H
Representative time‐lapse imaging of a single UiSomitoid (n = 10 biological experiments), pepper, HES7 mRNA–8pepper; Ph—phase. Scale bar, 400 μm.