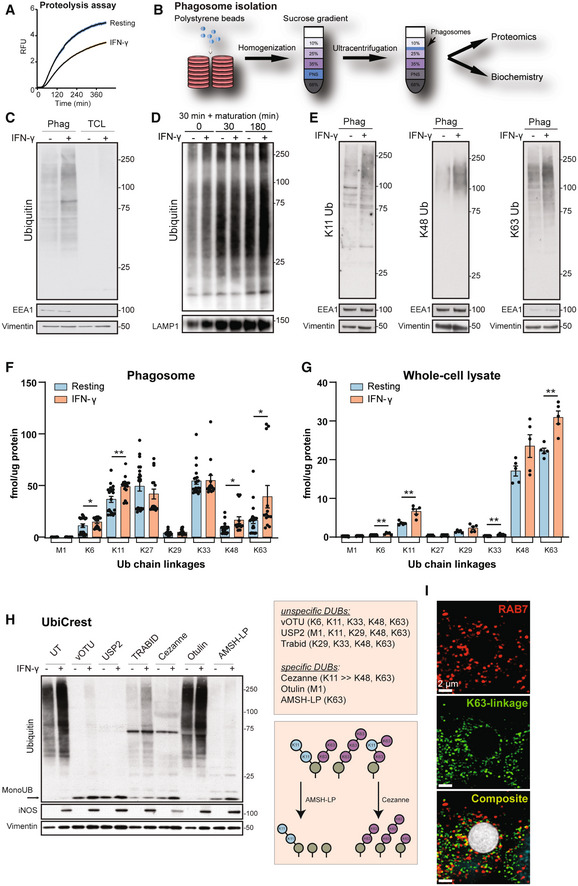
Figure 1. Characterisation of phagosomal ubiquitylation.

-
AIntraphagosomal proteolysis assay shows that IFN‐γ activation of macrophages reduces phagosomal maturation. Shaded area represents SEM (six technical replicates; representative graph of three independent experiments).
-
BWorkflow of phagosome isolation.
-
C–EWestern blots showing increased polyubiquitylation on phagosomes compared to Total Cell Lysate (TCL) and further increases by IFN‐γ activation (C, E). Equal protein amounts were loaded for phagosomal and TCL samples. Vimentin serves as loading control; EEA1 as purity marker. (D) Phagosomal ubiquitylation is not changing substantially over the maturation of the phagosome (30 min pulse, 0, 30 and 180 min chase, respectively). LAMP1 serves as purity marker. Representative images of three replicates.
-
FUbiquitin AQUA PRM assay for phagosomes from RAW264.7 cells shows abundance of atypical chains and increases for K6, K11, K48 and K63 chains on phagosomes in response to IFN‐γ activation. As the experiment is complex and has inherent variability, five independent experiments of three biological replicates were combined. M1 represents linear ubiquitin chains. M1 = linear ubiquitin chains. Error bars represent SEM of five biological replicates.
-
GUbiquitin AQUA PRM assay of total cell lysates of RAW264.7 cells. Error bars represent SEM of three technical replicates in three independent experiments.
-
HUbiquitin Chain Restriction (UbiCRest) experiment removing polyubiquitin chains from phagosomal extracts using specific and unspecific DUBs. UT = untreated.
-
IRepresentative immunofluorescence micrograph showing that K63 polyubiquitin (in green) localises around the phagosome defined by Rab7 staining (in red). Bead size (in white): 3 μm. To account for people with red‐green colour‐blindness, we have added a magenta/cyan/yellow version in Appendix Fig S2. Scale bar is 2 μm.
Data information: *P‐value < 0.05; **P‐value < 0.01 by paired two‐tailed Student's t‐test. Relative mobilities of reference proteins (masses in kDa) are shown on the right of each blot.
