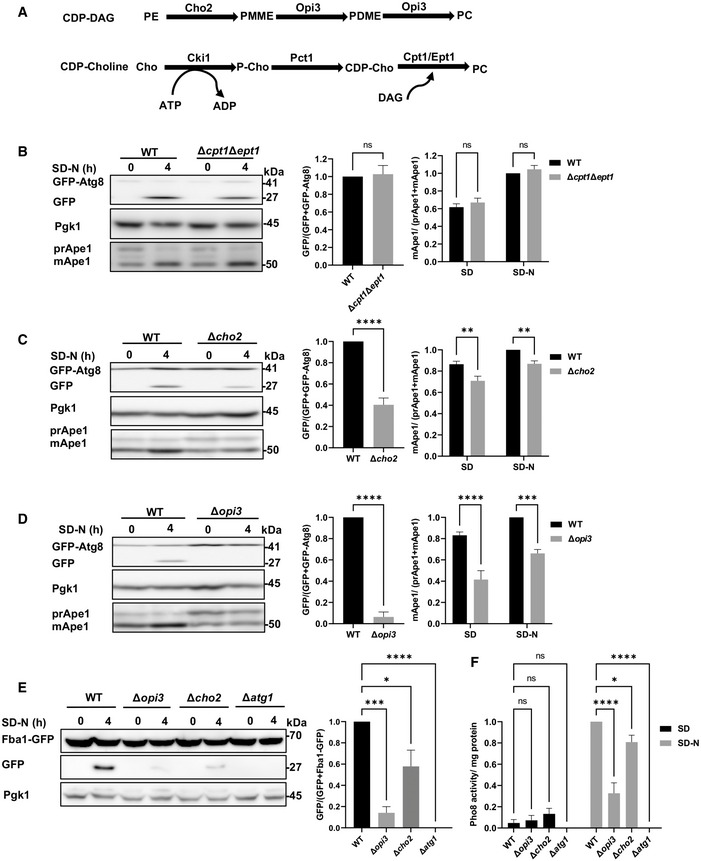
Figure 1. Loss of PC biosynthesis via the CDP‐DAG pathway impairs autophagic flux.

-
AScheme of PC biosynthesis pathways in the yeast Saccharomyces cerevisiae.
-
B–DWT, ∆cpt1∆ept1 (B), Δcho2 (C), or Δopi3 (D) cells expressing GFP‐Atg8 were grown to logarithmic phase in SD‐URA, and shifted to SD‐N for 4 h of starvation. Cells were harvested at indicated time points and subjected to western blotting (left panel). Pgk1 was used as a loading control. Middle panel‐ Autophagic activity during starvation was quantified by calculating the ratio of free GFP to total GFP (GFP‐Atg8 + free GFP). Statistical analysis was done by Student's t‐test (paired, two tailed; ns, not significant, ****P ≤ 0.0001), error bars represent SEM of at least 3 independent experiments. Right panel‐ Ape1 maturation was quantified by measuring the mApe1 level out of the total Ape1 amount, during SD and SD‐N. Statistical analysis was done by ANOVA multiple comparisons test‐Sidak's, compared with WT (ns, not significant, **P ≤ 0.005, ****P ≤ 0.0001), error bars represent SEM of at least 3 independent experiments.
-
EWT, Δopi3, Δcho2 and Δatg1 (negative autophagy control) cells expressing chromosomally tagged Fba1‐GFP were grown to log phase in SD, and starved in SD‐N for 4 h. Cells were harvested at indicated starvation time points and subjected to western blotting (left panel). Pgk1 was monitored as a loading control. Right panel—autophagic activity during starvation was quantified, by calculating the ratio of free GFP to total GFP (Fba1‐GFP + free GFP). Statistical analysis was done by ANOVA, Dunnet's multiple comparisons test (*P ≤ 0.05, ***P ≤ 0.0005, ****P ≤ 0.0001), error bars represent SEM of at least 3 independent experiments.
-
FWT, Δopi3, Δcho2 and Δatg1 cells on the background of pho8Δ60 pho13Δ strain, were grown to log phase in SD, and starved in SD‐N for 4 h. Pho8 activity was measured by the alkaline phosphatase assay. Statistical analysis was done by ANOVA, Dunnet's multiple comparisons test (ns, not significant, *P ≤ 0.05, ****P ≤ 0.0001), error bars represent SEM of at least 3 independent experiments.
Source data are available online for this figure.
