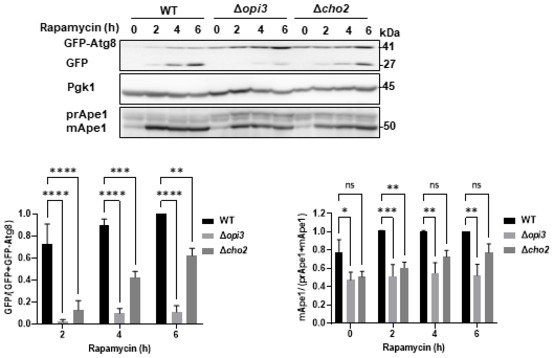
Figure EV1. Rapamycin induced autophagy is inhibited in PC deficient strains.

WT, Δopi3 and Δcho2 cells expressing GFP‐Atg8 were grown to log phase in SD‐URA and treated with rapamycin (200 ng/ml) for the indicated durations. Cells were harvested at indicated time points and subjected to western blotting (left panel). Pgk1 was monitored as a loading control. Bottom left panel‐ Autophagic activity was quantified during indicated time points of starvation, by calculating the ratio of free GFP to total GFP (GFP‐Atg8 + free GFP). Statistical analysis was done by ANOVA multiple comparison test‐Dunnett's, compared with WT (**P ≤ 0.005, ***P ≤ 0.005, ****P ≤ 0.0001), error bars represent SEM of at least 3 independent experiments. Bottom right panel‐Ape1 maturation was quantified by measuring the mApe1 level out of the total Ape1 amount, during indicated time points. Statistical analysis was done by ANOVA multiple comparison test‐Dunnett's, compared with WT (*P ≤ 0.05, **P ≤ 0.005, ***P ≤ 0.005, ns, not significant), error bars represent SEM of at least 3 independent experiments. Source data are available online for this figure.
