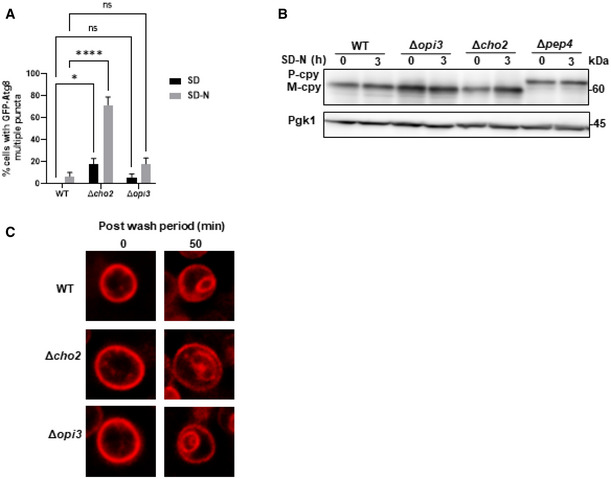
Figure EV2. PC deficiency specifically compromises the autophagic pathway.

- Quantification of cells with multiple GFP‐Atg8 puncta during SD and SD‐N. WT, Δopi3, Δcho2 cells expressing GFP‐Atg8 were grown to log phase in SD‐URA and shifted to SD‐N for 3 h. Percentage of cells with more than two GFP‐Atg8 puncta per cell GFP‐Atg8 puncta was counted. Statistical analysis was done by ANOVA multiple comparisons test‐Sidak's (*P ≤ 0.05, ****P ≤ 0.0001, ns, not significant), error bars represent SEM of 3 independent experiments. Number of cells analyzed for each strain and condition, SD: WT (n = 446), Δopi3 (n = 272), Δcho2 (n = 272), SD‐N: WT (n = 398), Δopi3 (n = 213), Δcho2 (n = 224).
- CPY maturation assay: precursor CPY (pCPY) is transported to the vacuole and processed into a mature form (mCPY) in the vacuolar lumen. WT, Δopi3 and Δcho2 cells, as well as Δpep4 cells as negative control for CPY maturation, all expressing GFP‐Atg8, were grown to log phase in SD‐URA, and shifted to SD‐N for 3 h. Cells were harvested at the indicated time points and subjected to western blotting (Fig 2B). Pgk1 was monitored as loading control.
- WT, Δopi3 and Δcho2 cells were grown to log phase in SD medium, stained for 30 min on ice with FM4‐64, washed 3 times with cold SD, and observed at indicated time points after wash by widefield microscopy (Fig 2C). Scale bar 1 μm.
Source data are available online for this figure.
