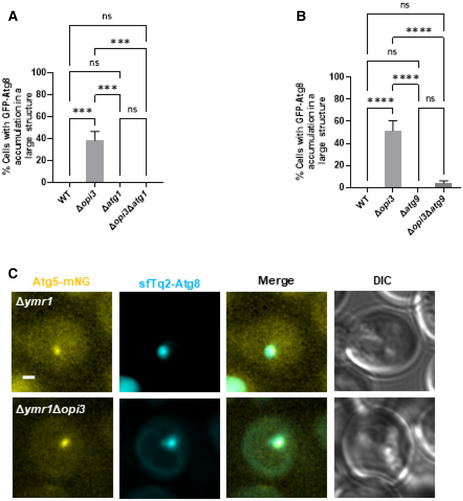
Figure EV3. Phospholipid imbalance leads to accumulation of bona fide autophagic structures.

-
A, BQuantification of imaged data shown in Fig 5A and B, respectively, of cells with GFP‐Atg8 accumulation in large structures. Statistical analysis was done by ANOVA multiple comparisons test‐Tukey's (****P ≤ 0.0001, ns, not significant) error bars represent SEM of least 3 independent experiments. Number of cells analyzed for each strain. Panel (A): WT (n = 298), Δopi3 (n = 510), Δatg1 (n = 179), Δopi3Δatg1 (n = 177), Panel (B): WT (n = 349), Δopi3 (n = 564), Δatg9 (n = 275), Δopi3Δatg9 (n = 253).
-
CRepresentative images of mNG‐tagged Atg5 colocalized with sfTq2‐Atg8 on the background of Δymr1. WT and Δopi3 cells were grown to log phase in SD medium, and shifted to SD‐N. Images were taken during SD‐N (1–3 h) by widefield microscopy. Scale bar 1 μm.
