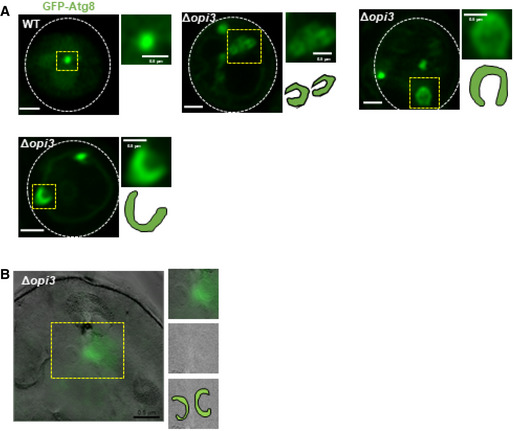
Figure EV4. Phospholipid imbalance leads to accumulation of elongated unsealed phagophores.

- Representative images of autophagic structures in WT and Δopi3 cells expressing GFP‐Atg8. Cells were grown to log phase in SD‐URA medium, shifted to SD‐N for 3 h and observed by Airyscan microscopy. White dashed lines indicate cell boundaries, yellow dashed area indicate autophagic structures. For each cell—whole cell (left), magnification of yellow dashed area (top right) and schematic representation (bottom right). Scale bar 1 μm, 0.5 μm (enlarged images).
- Representative CLEM image of Δopi3 cells expressing GFP‐Atg8, grown to log phase in SD‐URA medium and shifted to SD‐N for 3 h. Cells were harvested, deep frozen and processed for CLEM (left), V‐vacuole. For each cell—magnification of yellow dashed area of GFP‐Atg8 positive phagophore (top right), TEM image only (middle right), schematic representation of phagophores (bottom right). Scale bar 1 μm (left).
