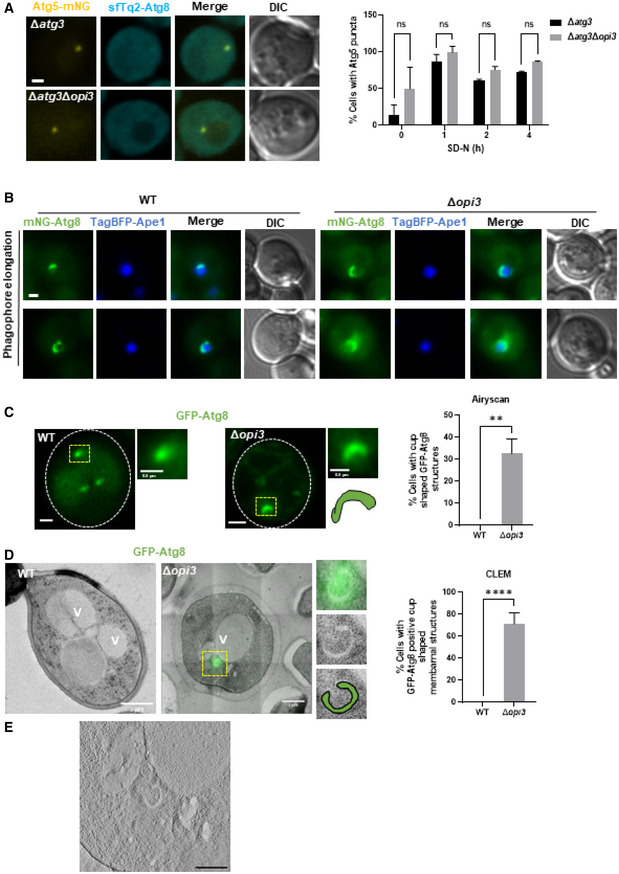
Representative Images of Atg5‐mNG with sfTq2‐Atg8 during SD‐N. Δatg3 and Δatg3Δopi3 cells were grown to log phase in SD medium, shifted to SD‐N for 4 h, and observed by Widefield microscopy (left panel), scale bar 1 μm. Right panel‐ quantification of percentage of cells with Atg5 puncta during different time points. Statistical analysis was done by ANOVA multiple comparisons test‐Sidak's (ns, not significant), error bars represent SEM of 2 independent experiments. Number of cells analyzed for each strain and time point (0 h: Δatg3 (n = 296), Δatg3Δopi3 (n = 111), 1 h: Δatg3 (n = 325), Δatg3Δopi3 (n = 110), 2 h: Δatg3 (n = 338), Δatg3Δopi3 (n = 135), 4 h: Δatg3 (n = 309), Δatg3Δopi3 (n = 167)).
Representative images of WT and Δopi3 cells expressing TagBFP‐Ape1 under the native APE1 promoter and Ape1 under the CUP1 promoter. Cells were grown to log phase in SD‐LEU medium in the presence of 500 μM copper sulfate, and observed by Widefield microscopy, scale bar 1 μm.
Representative images of WT and Δopi3 cells expressing GFP‐Atg8. Cells were grown to log phase in SD‐URA medium, shifted to SD‐N for 3 h and observed by Airyscan microscopy (left panel). White dashes indicate cell boundaries, yellow dashes indicate autophagic structures. For each cell—Magnification of yellow dashed area (top right), schematic representation (bottom right). Scale bar 1 μm. Right panel‐ quantification of the percentage of cells with cup shaped GFP‐Atg8 structures imaged by Airyscan microscopy. Statistical analysis was done by Student's t‐test (unpaired; **P ≤ 0.05), error bars represent SEM of least 3 independent experiments. Number of cells analyzed for each strain, WT (n = 45), Δopi3 (n = 110).
Representative CLEM images of WT and Δopi3 cells expressing GFP‐Atg8, grown to log phase in SD‐URA medium and shifted to SD‐N for 3 h. Cells were harvested, deep frozen and processed for CLEM (left panel), V‐vacuole. For Δopi3 cell—Magnification of yellow dashed area of GFP‐Atg8 positive phagophore (top right), TEM image only (middle right), schematic representation of a phagophore (bottom right). Scale bar 1 μm. Right panel‐ quantification of the percentage of cells with GFP‐Atg8 positive cup shaped membrane structures imaged by CLEM. Statistical analysis was done by Student's t‐test (unpaired; ***P ≤ 0.005), error bars represent SEM of least 3 independent experiments. Number of cells analyzed for each strain, WT (n = 20), Δopi3 (n = 21).
Tomogram slice of CLEM Δopi3 image (D), focused on the phagophore, thickness of 120 nm, scale bar 500 nm.

