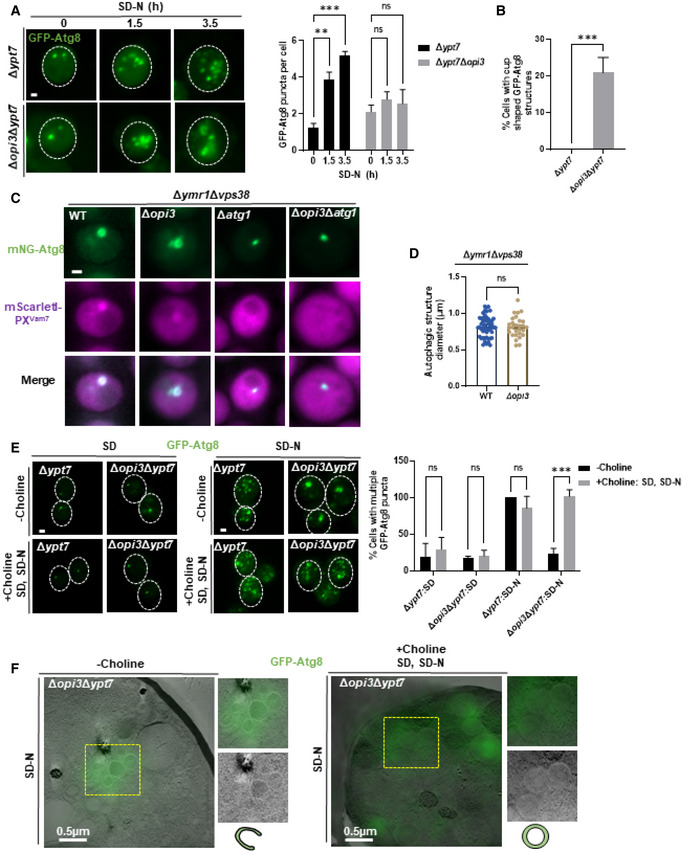
Representative images of Δypt7, Δopi3Δypt7 expressing GFP‐Atg8 (z‐stack projection). Cells were grown to log phase in SD‐URA medium and starved in SD‐N, images were taken during starvation in indicated time points by widefield microscopy (left panel). Scale bar 1 μm. Right panel‐ quantification of GFP‐Atg8 puncta per cell in Δypt7, Δopi3Δypt7 at indicated time points. Statistical analysis was done by ANOVA multiple comparisons test‐Sidak's (***P ≤ 0.001, **P ≤ 0.005, ns, not significant), compared with WT. Error bars represent SEM of least 3 independent experiments. Number of cells analyzed for each strain and time point, 0 h: Δypt7 (n = 322), Δopi3Δypt7 (n = 194), 1.5 h: Δypt7 (n = 220), Δopi3Δypt7 (n = 155), 3.5 h Δypt7 (n = 216), Δopi3Δypt7 (n = 307).
Quantification of cup‐shaped phagophores in Δypt7 and Δopi3Δypt7 cells expressing GFP‐Atg8 during starvation (1‐3 h). Statistical analysis was done by Student's t‐test (***P ≤ 0.001), error bars represent SEM from at least 3 independent experiments. Number of cells analyzed for each strain, Δypt7 (n = 347), Δopi3Δypt7 (n = 474).
Representative images of mNG‐tagged Atg8 colocalized with mScarletI‐PXVam7. WT, Δopi3, Δatg1 and Δopi3Δatg1 cells on the background of Δymr1, expressing mScarletI‐PXVam7 under the CUP1 promoter from the knocked‐out VPS38 locus, were grown to log phase in SD medium in the presence of 10 μM copper sulfate, and shifted to SD‐N in the presence of 10 μM copper sulfate. Images were taken during SD‐N (1–3 h) by widefield microscopy. Scale bar 1 μm.
Quantification of autophagic structure diameters in WT and Δopi3 cells on the background of Δymr1Δvps38 (C) by ImageJ. Statistical analysis was done by Student's t‐test, unpaired, two sided (ns, not significant), error bars represent SEM of at least three independent experiments. Number of cells analyzed for each strain, WT (n = 51), Δopi3 (n = 28).
Representative images of Δypt7, Δopi3Δypt7 cells expressing GFP‐Atg8 (projection). Cells were grown to log phase in SD‐URA medium and starved in SD‐N, with supplementation of choline (1 mM) to SD and SD‐N as indicated. Images were taken during growth and starvation by confocal microscopy (left panel). Scale bar 1 μm. Right panel‐ quantification of cell with more than two GFP‐Atg8 puncta, in Δypt7 and Δopi3Δypt7 at growth (SD) or starvation (SD‐N) in the presence (+choline: SD, SD‐N) or absence (−choline) of choline (1 mM). Incidence were normalized to Δypt7 (SD‐N) control. Statistical analysis was done by ANOVA multiple comparisons test‐Sidak's (ns, not significant, ***P ≤ 0.001). Error bars represent SEM of least 3 independent experiments. Number of cells analyzed for each strain and condition, SD: Δypt7 (n = 209), Δopi3Δypt7 (n = 111), SD‐N: Δypt7 (n = 118), Δopi3Δypt7 (n = 103), SD + Choline: Δypt7 (n = 107), Δopi3Δypt7 (n = 120), SD‐N+ Choline: Δypt7 (n = 84), Δopi3Δypt7 (n = 74).
CLEM images of Δopi3Δypt7 cells expressing GFP‐Atg8, grown to log phase in SD‐URA medium and shifted to SD‐N for 4 h, with supplementation of choline (1 mM) excluded (−choline) or present at growth and starvation (+choline SD, SD‐N) as indicated. Cells were harvested, deep frozen and processed for CLEM. For each cell—whole cell (left), magnification of yellow dashed area of GFP‐Atg8 positive phagophore (top right), TEM image only (middle right), schematic representation of autophagic structure (bottom right). Scale bar 0.5 μm.

