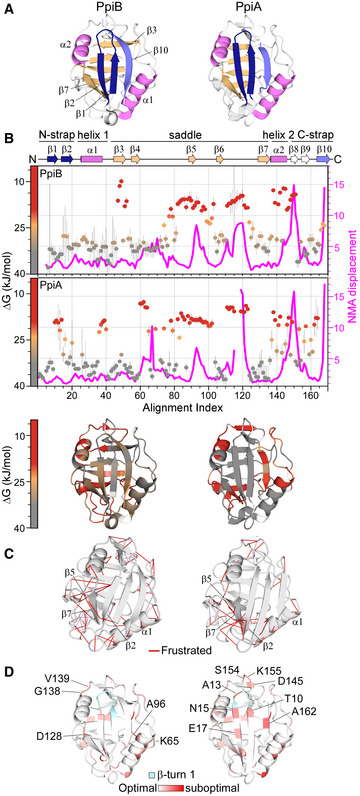
Figure 1. Structural features of PpiB and PpiA.

- Structural features are colour‐indicated on 3D structures (top) or linear map of secondary structure (bottom; from Appendix Fig S1D). β‐strands that connect the sheets to form the straps and quasi β‐barrel and α‐helices as annotated.
- Dynamics of native PpiA/B. Top left y‐axis (reversed) displayed as ΔG/residue (from PyHDX analysis of HDX‐MS data at 30°C) colour‐indicated across the linear sequence (top; x‐axis) or on 3D structures (bottom). The apparent rigidity at the extreme N‐tail of PpiA was attributed to high back exchange of this peptide and, therefore, ignored. Dots: grey (stable); orange (flexible); red (unstructured). Grey error bars: variation between subsequent residues (see Fig EV1E for %D‐uptake values; HDX‐MS data in Dataset EV4). n = 3 technical repeats. Top, right y‐axis: normal mode analysis; total displacement of normal modes 7–13 (unweighted sum; magenta) (see Materials and Methods).
- Direct frustrated interactions (red lines) and water‐mediated ones (purple, dashed) are indicated on 3D structures.
- Suboptimal residue/structure compatibility determined by Rosetta scoring analysis coloured using a gradient (see Materials and Methods) on the 3D structures.
Data information: The PDB entries used are as follows: 1LOP for PpiB and 1V9T for PpiA.
Source data are available online for this figure.
