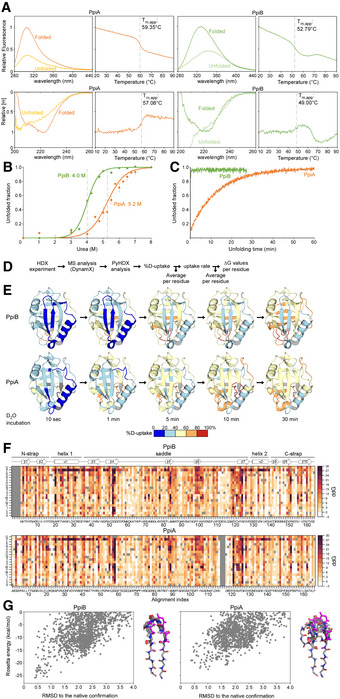
Figure EV1. Structural dynamics and stability analysis of the native state of PpiB and PpiA (related to Fig 1).

-
ARaw data of thermal denaturation analysis monitored by intrinsic fluorescence (top, in relative units setting the highest value at 1 with excitation at 260 nm and emission at 327 for PpiA and PpiB based on the mainly buried tyrosine residues, as PpiA does not contain Trp and PpiB only contains an outward facing one and circular dichroism (bottom, CD; in relative molar ellipticity ([θ]) with highest value at 1) at 222 nm. The full spectrum of the folded (protein at 25°C) and unfolded state (protein at T m,app + 5°C) is displayed on the left, and apparent melting temperature (T m,app) on the right was determined after smoothening the curves with a Butterworth filter (see Materials and Methods) and plotting the first derivative where the maximum (CD) or minimum (Intrinsic Fluorescence) was determined using a Python script (see Materials and Methods). The T m,app is indicated on the graph with a dotted grey line. n = 3 technical repeats.
-
BChaotrope denaturation analysis in urea monitored by CD at 222 nm (depicted as unfolded fraction calculated from [θ] of the unfolded protein (8 M Urea) set as 1 and that of the natively purified protein (0 M Urea) set as 0). The raw data are shown with dots and fitted using a two‐state transition model ((Lowe et al, 2018), see Materials and Methods) to determine the transition midpoint. n = 3 technical repeats, s.d.
-
CUnfolding of PpiB (green) and PpiA (orange) from their native states in 8 M Urea monitored with CD at 22°C at 222 nm (depicted as the unfolded fraction (as in B.)).
- D
-
EStructural dynamics of the native state of PpiB and PpiA derived from local HDX‐MS analysis (Fig 1B). The weighted average %D‐uptake at the indicated HDX time was mapped on the 3D structures (PpiB PDB 1LOP, PpiA PDB 1V9T). 0–20%, 20–40%, 40–60%, 60–80% and 80–100% Deuterium uptake intervals are shown in the indicated colour scale. Residues without coverage are in grey. n = 3 technical repeats.
-
FMutational free energy (ddG) predictions for PpiB (PDB 1LOP and PpiA (PDB 1V9T) using in silico mutagenesis displayed as a custom colour map with all substitutions indicated (see scripts on GitHub). Missing residues from alignment and native residues are in dark grey. Increase in ddG values (brown colour) signifies mutations that destabilize the structure or a more stable native residue, while decrease in ddG values (white) signifies the possibility of other residues to fit that same position.
-
GComputed conformation/energy landscape of β‐hairpin 1 of PpiB (left, PDB 1LOP) and PpiA (right, PDB 1V9T). Each point represents one decoy generated with the Rosetta KIC protocol, scored based on Rosetta total_score and aligned to the native structure. The structure of the 10 lowest energy decoys for each protein is presented on the right side of each graph.
Source data are available online for this figure.
