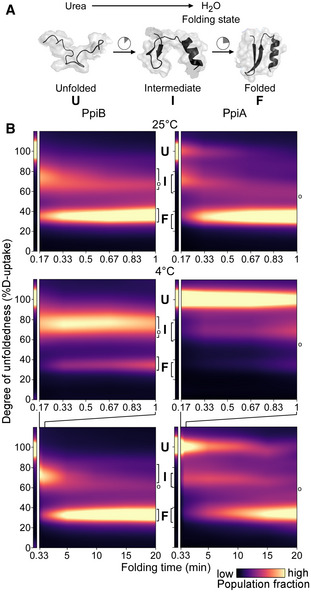
Figure 2. Comparison of PpiB and PpiA folding by global HDX‐MS.

-
ACartoon representation of in vitro refolding protein over time, upon dilution from chaotrope into aqueous buffer.
-
BFolding kinetics of PpiB (left) and PpiA (right), at 25°C (1 min, top) or 4°C (1 and 20 min, bottom). Folding populations are displayed as a continuous colour map of their %D‐uptake (y‐axis) across time (x‐axis). For m/z spectra, see Fig EV2B and C; Dataset EV3. n = 2–6 (biological repeats). Left thin panels: unfolded state (U; 6 M urea); Right main panels: refolding data (0.2 M urea); I, Intermediate; F, Folded populations; o, modifications/adducts, not part of the folding pathway.
