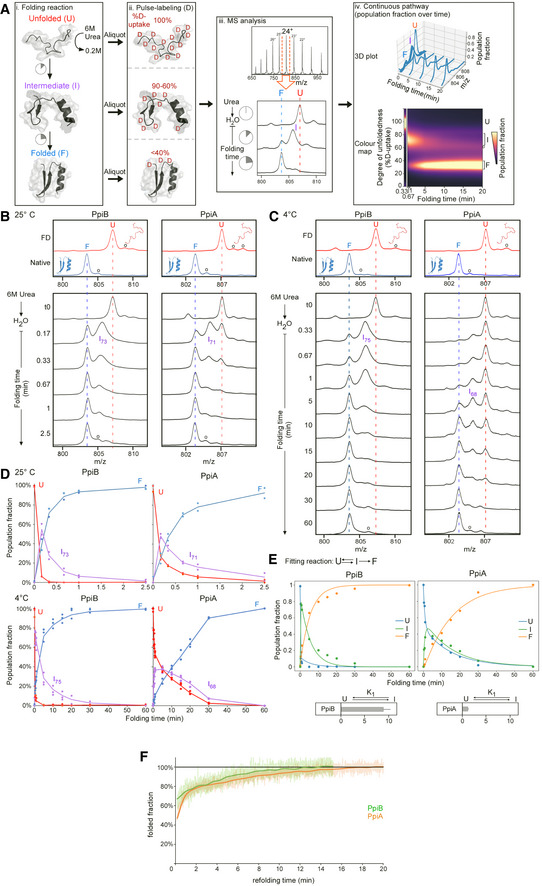
Pipeline of processing
in vitro refolding kinetics of intact proteins using global HDX‐MS analysis and subsequent visualization as a colour map (Fig
2B). (i) Denatured proteins are refolded out of chaotrope (6 M urea) into aqueous buffer where the different folding states are observed. (ii) An aliquot of the refolding reaction is removed at different timepoints and pulse‐labelled in high % D
2O where the amount of Deuterium taken up reflects the number of non‐H‐bonded/solvent‐accessible backbone amides and is inversely related to how folded (i.e. stably H‐bonded) the protein is. The unfolded state (6 M Urea) is experimentally defined as a single peak/population with maximum D‐uptake (set as 100%), followed by intermediate D‐uptake and finally the lowest D‐uptake for the folded state. (iii) From the electrospray ionisation MS analysis of each refolding timepoint, an m/z spectrum with multiple charged m/z peaks is obtained. From the latter, a single high‐intensity peak (highest Signal over Noise) is selected and smoothed (Savitzky‐Golay, window: 15, number: 5) to be followed over different refolding timepoints (as depicted in the bottom section). Due to Deuterium being 1 Da heavier than Hydrogen, a shift from a high to lower m/z is observed over time as the protein folds and takes up fewer Deuterium during pulse‐labelling. “o”: Potassium adducts and Urea modification peaks that are visible on the (un)folded state. (iv) The intensities of the folding populations from the single m/z peak at different timepoints are normalized to the integrated area (See
Materials and Methods). To observe the conversion of the folding populations over time, a 3D plot was displayed with all the normalized m/z spectra over time. The normalized intensities now reflect the population fractions of each folding state. Linear interpolation was performed between the m/z spectra over time to get a continuous time course of the refolding pathway and used to create a 2D colour map to visualize the interconversion between folding states indicated based on their degree of unfoldedness (%D‐uptake). The colour gradient (“magma” colourmap) reflects increasing population fractions ranging from small (dark) to high (yellow; see
Materials and Methods, Dataset
EV3C).

