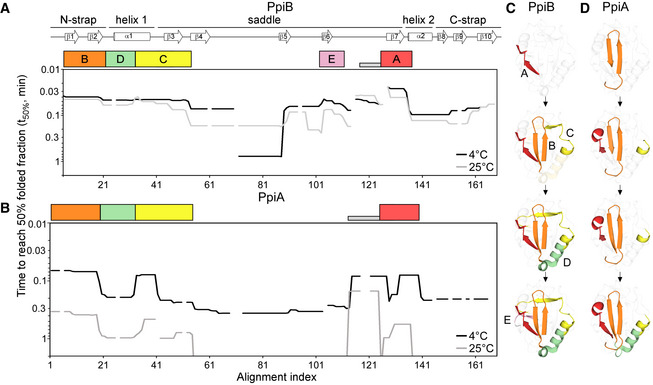
Folding kinetics of PpiB (A) and PpiA (B) at 25 or 4°C, monitored by local HDX‐MS (Dataset
EV4;
n = 3 biological repeats), were analysed by PyHDX to determine the folded fractions per residue (Dataset
EV5); see pipeline of analysis in Fig
EV3B and folding times in Fig
EV3E. For each peptide, 100% folding was set to the D‐uptake of the native protein peptide and 0% folding to the D‐uptake of the same peptide under fully deuterated conditions. Initial foldons were assigned by plotting the time needed to reach 50% of folded fraction (t
50%;
y‐axis; Dataset
EV5) along the linear sequence (
x‐axis), at both temperatures (as indicated). Only up to 1 min data are shown here (see extended dataset colour map in Appendix Fig
S2; raw data in Dataset
EV4). The alignment index is based on the sequence of PpiA (extended N‐tail; missing loop between β6‐β7; Appendix Fig
S1D). Gaps: residues absent in one of the twins, prolines or no experimental coverage. Colour boxes below the linear secondary structure map (top) indicate foldons, named in alphabetical order. Grey bar: unstructured fast folding regions (Fig
EV3D) omitted from analysis.

