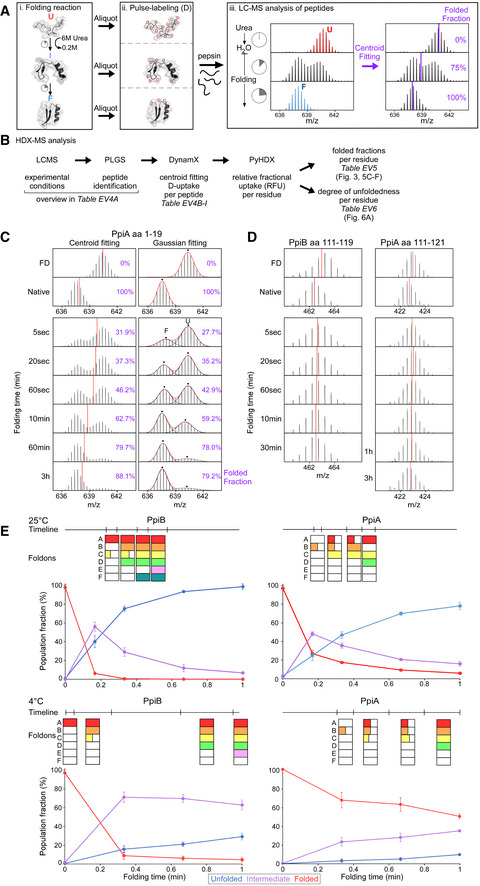
Figure EV3. Rates and spectra of refolding kinetics analysed with local HDX‐MS of PpiA and PpiB at 25 and 4°C (related to Fig 3).

-
APipeline of processing in vitro refolding kinetics of pepsinized proteins using local HDX‐MS analysis (Fig 2B). (i) Denatured proteins are refolded out of chaotrope (6 M urea) into aqueous buffer where the different folding states are observed. (ii) An aliquot of the refolding reaction is removed at different timepoints and pulse‐labelled in high %D2O where the amount of Deuterium taken up reflects the number of non‐H‐bonded/solvent‐accessible backbone amides and is inversely related to how folded (i.e. stably H‐bonded) the protein is. Pulse‐labelled proteins are pepsinized to determine the D‐uptake of each peptide to obtain folding details. (iii) All peptides are identified by their retention time during Liquid Chromatography and their m/z spectrum (Englander et al, 2007; Tsirigotaki et al, 2017b). The unfolded and folded state are a single distribution with the highest and lowest D‐uptake, respectively, where during folding the conversion from a completely unfolded to the folded state is observed (bimodal distributions, EX1 HDX kinetics (Englander et al, 2007; Tsirigotaki et al, 2017b)). The average D‐uptake of each distribution is determined using a centroid that gets converted to the folded fraction using the D‐uptake of the unfolded state as 0% folded and that of the folded state as 100%.
-
BThe schematic pipeline describes the steps of analysis we performed on the local HDX‐MS data using PyHDX, in order to obtain folded fractions per residue or degree of unfoldedness per residue. Data from different steps are presented on separate Datasets (as indicated) and were used on the indicated Figures.
-
CComparison in data processing of a PpiA peptide to calculate folded fractions (results in Dataset EV5 per residue) using centroids vs. Gaussian fitting. Peptide aa1‐19 demonstrates folding with bimodal distributions. Left, the centroid position (red line) of the peptide is used to determine the folded fraction (unfolded m/z value is 0% folded and natively purified protein is 100% folded). Right, the unfolded (U, high m/z) and folded (F, low m/z) distributions are fitted with Gaussian curves (individual Gaussians: dashed lines, fit: red line and dots for the mean of each Gaussian) to determine the % area of the folded one. For both, the folded fractions calculated from centroid and Gaussian curve fitting are shown in purple. Use of the centroid approach avoided the fitting of very broad unfolded Gaussian peaks at later timepoints and was preferred hereafter.
-
DRefolding analysis of two peptides from regions in PpiB and PpiA at 4°C that display small D‐uptake differences between the unfolded and the folded state and only display very minor shift of the whole spectra during refolding. The centroid is depicted as a red line. Both sites did not show any distinct folding and were left out of the analysis (grey bar, Fig 3A and B).
-
EComparing foldons from local HDX‐MS to global HDX‐MS data. The foldons from Fig 3 are displayed on top (based on t 80% or t 50%, Dataset EV5) with their formation timeline where they are coloured after formation in a time interval. If only sections (half or one third) of the foldon are formed this is indicated in the square. These foldons timelines are aligned to the global HDX‐MS data where only 1 min of refolding is shown from Fig EV2D.
