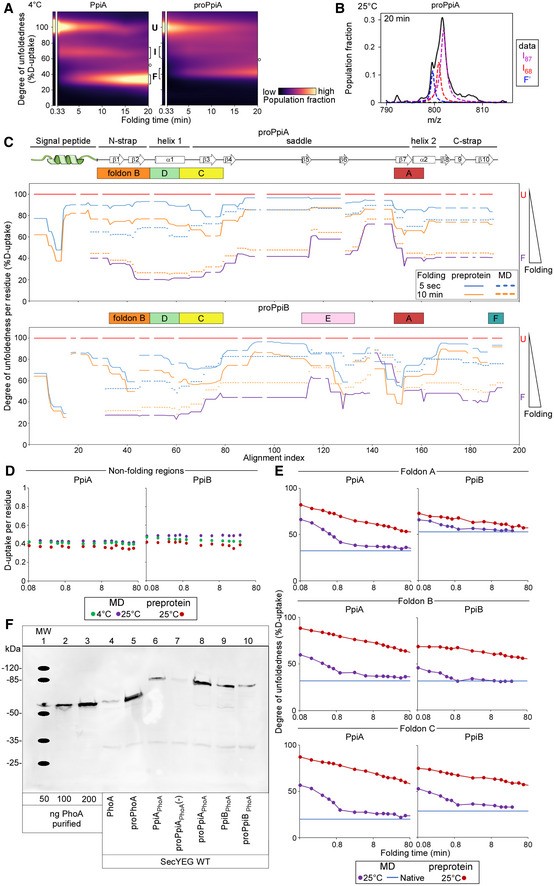
Figure EV5. Refolding kinetics of (pro)PpiA and (pro)PpiB at 25°C analysed with local HDX‐MS followed by secretion efficiency (related to Figs 3, 5 and 6).

-
ARefolding pathway of PpiA and proPpiA at 4°C. The folding populations are displayed as a continuous colour map over time based on their %D‐uptake (Dataset EV3). The unfolded state (6 M urea, left) is separated from the refolding data in 0.2 M Urea. The Unfolded (U), Intermediate (I) and Folded (F) populations are indicated with brackets. “o” refers to modifications/adducts of the folded state that are not part of the folding pathway. The left panel contains the same data and image as in Fig 2B bottom right panel and is used again here to facilitate comparison.
-
BFitting of the two Lorentzian curves on the broad intermediate of the global HDX‐MS data of proPpiA refolding at 25°C (20 min, Fig 5B). The data were fitted with 3 folding states consisting of the I87, I68 and “folded” (F') state as annotated on the right.
-
CDegree of unfoldedness per residue of proPpiA and proPpiB (signal peptide fused using PpiA N‐terminal tail) during folding (%D‐uptake, data in Dataset EV6) where reduced degree of unfoldedness is related to gain of secondary structure that is shown on the top (based on Appendix Fig S1D). The %D‐uptake during pulse‐labelling is defined by the fully denatured control (FD; 100% D‐uptake) and shown for the preprotein (full line) and mature domain PpiA/PpiB (MD, dashed line). The degree of unfoldedness per residue of the natively folded protein is displayed in purple. Foldons are displayed on top; residues with no coverage as indicated. n = 3 biological repeats.
-
DD‐uptake of peptide in the non‐folding regions during refolding. PpiA or PpiB (green: 4°C; purple: 25°C) vs. their preprotein derivatives (25°C in dark red) display no reduction in D‐uptake during folding and remain disordered and therefore were removed from the analysis (light grey bars, Figs 3E and F, and 5C and D). The peptides of (pro)PpiA (residues 137–145, proPpiA numbering) and (pro)PpiB (residue 140–149, proPpiB numbering) are displayed. n = 3 biological repeats.
-
EComparison of degree of unfoldedness (%D‐uptake) of peptides inside foldons between PpiA/PpiB and their preprotein derivatives (Figs 5C and D vs. 2E and F). Similar to (B), the degree of unfoldedness was determined for the whole peptide and displayed over folding time. Top, refolding of a peptide covering foldon A (β8‐α2) at 25°C for (pro)PpiA (same peptide, residue 146–157, proPpiA numbering) and (pro)PpiB (same peptide, residue 152–160, proPpiB numbering). Middle, refolding of foldon B (N‐strap) at 25°C in (pro)PpiA (same peptide, residue 24–42, proPpiA numbering) and (pro)PpiB (different peptide, residue 30–45 and 24–43, respectively, proPpiB numbering). Bottom, refolding of foldon C (end of α1) at 25°C for (pro)PpiA (same peptide, residue 56–64, proPpiA numbering) and (pro)PpiB (different peptide, residue 43–59 and 44–59, respectively, proPpiB numbering).
-
FIn vivo protein expression in the E. coli strain MC4100 at 30°C detected by immunostaining with α‐PhoA antibodies on western blots (PhoA secretion activity in Dataset EV9B). Transcription of ppiX‐phoA fusions carried on vector pBAD501 was induced in the cell (6.67 μM arabinose) and monitor PpiX secretion monitored (Fig 6A). Lanes 1–3, purified PhoA protein loaded at the indicated amounts used for quantification of protein expression. “‐”: uninduced cells containing the vector with the indicated constructs.
Source data are available online for this figure.
