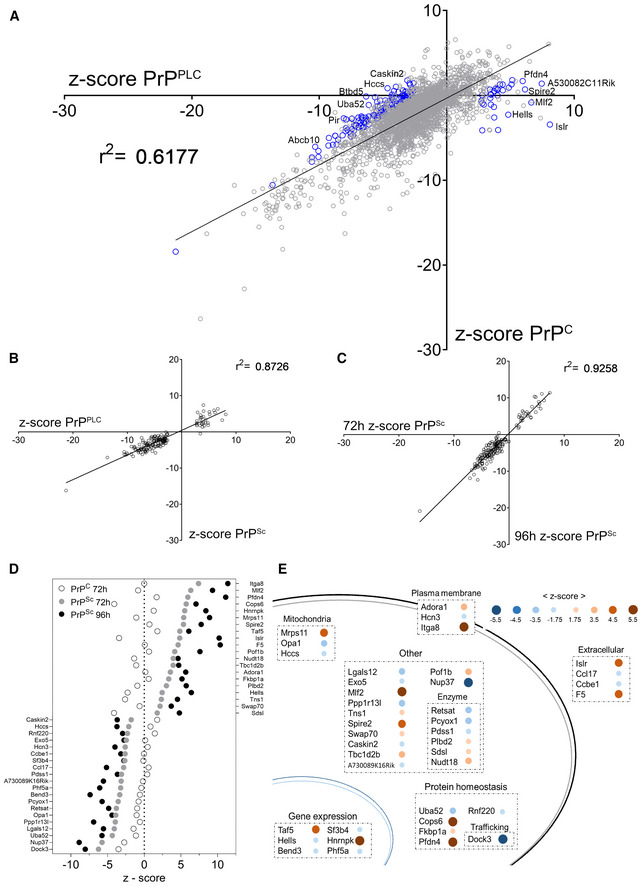
Figure 3. Secondary screens and shortlisting of 40 candidates.

- Regression of the values of the confirmatory screen for prion specific modulators in mock‐ and prion infected GT‐1/7 cells. Z‐scores of genes from the two independent screens, assessing either regulation of PrPC or PrPPLC, yield a coefficient of determination (r 2‐value) of 0.62 indicating that most genes are modulating prion levels via regulating PrPC. Blue circles indicate 161 prion specific hits selected for downstream counter screens. The most conspicuous modulators were labeled.
- Correlation of z‐scores obtained from a secondary screen to assess the effect of PK digestion on 161 PrPPLC modulators in RML GT‐1/7 cells after 72 h of RNAi treatment. Z‐scores of genes from the two independent screens (PIPLC or PK for two different sample preparation approaches) yield a coefficient of determination (r 2) of 0.87, indicating that the candidates regulate PK‐resistant prions.
- Correlation of the z‐scores obtained from the counter‐screenings to assess the effect of PK digestion on the prion modulators in RML GT‐1/7 cells after 72 and 96 h of RNAi treatment. The coefficient of determination (r 2‐value) of 0.93 and the increase in effect size for the prolonged treatment condition indicate a robust effect of the candidates on prion levels.
- Summary of the effect of the 40 shortlisted hits on PrPC (after 72 h) and PrPSc (after 72 and 96 h), assayed using PK digestion, given as z‐scores.
- Function and topology of the 40 hits. Blue dots: prion stabilizers; brown dots: prion limiters. Size and color saturation represent the effect size of each hit based on its z‐score (72 h RNAi treatment; PK readout).
