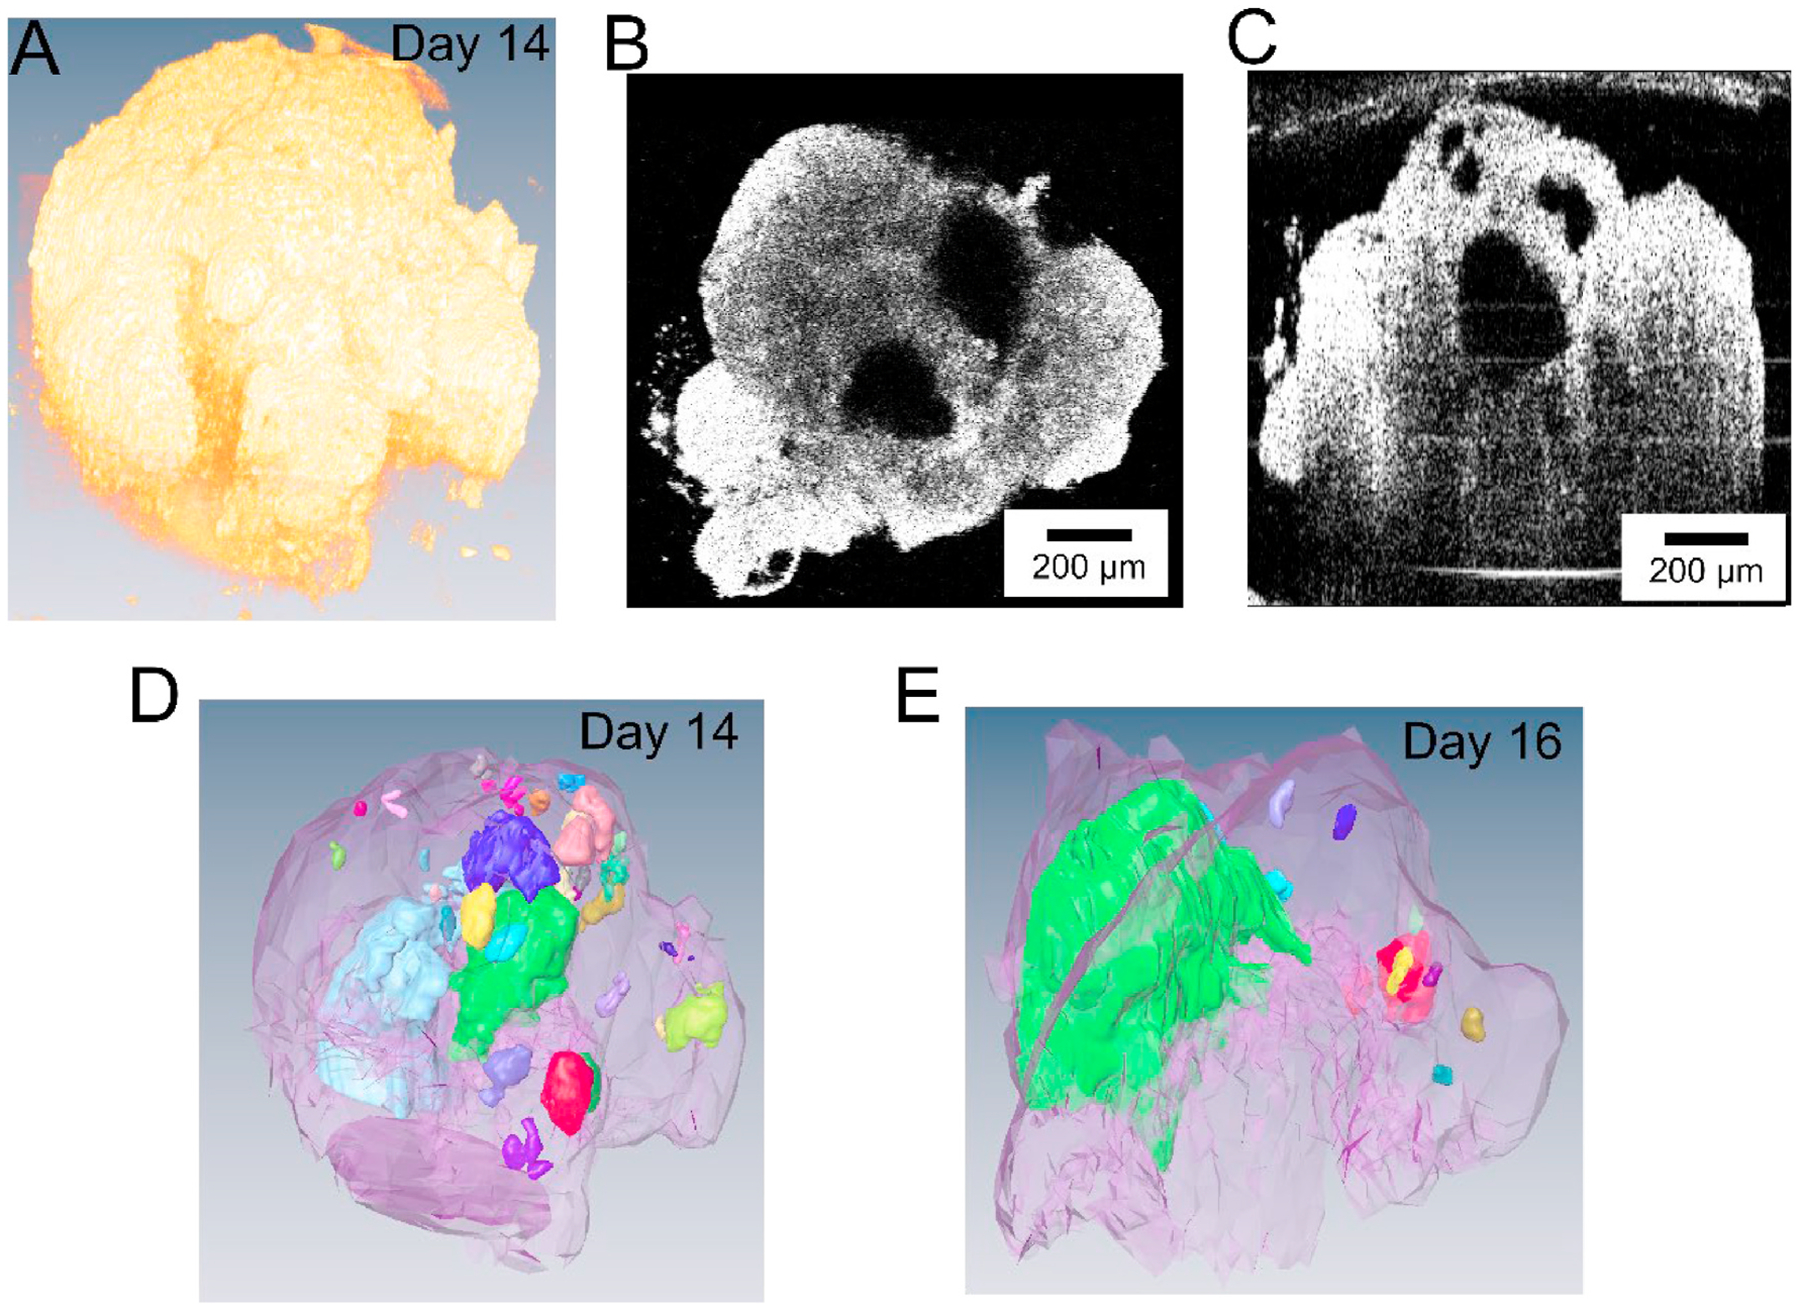
Fig. 2.

OCT imaging and 3D rendering of a representative human heart organoid. (A) 3D rendering of the organoid. (B) En face and (C) cross-sectional views of the heart organoid. Scale bars: 200 μm. (D) Segmentation of the organoid and the inside cavities. Cavities in different colors are independent (not connected). Panels A–D show the organoid on day 14. (E) Segmentation of the same organoid on day 16.
