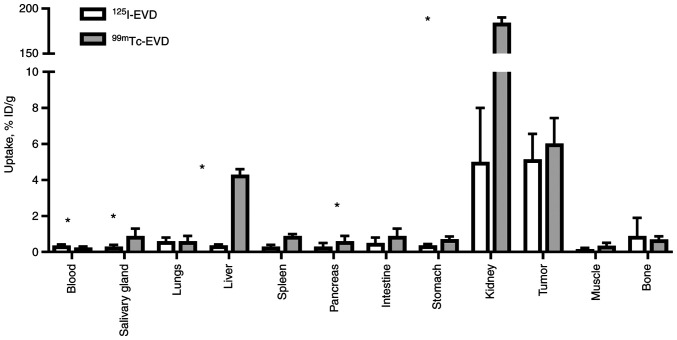
Figure 4.
Comparative biodistribution of 99mTc-EVD and 125I-EVD at 3 h post-injection in mice bearing renal carcinoma xenografts. Data are presented as percent ID per gram. Error bars indicate the standard deviation. *P<0.05, 99mTc-EVD vs. 125I-EVD (paired t-test). EVD, epithelial cell adhesion molecule-visualizing designed ankyrin repeat protein; ID, injected dose.

