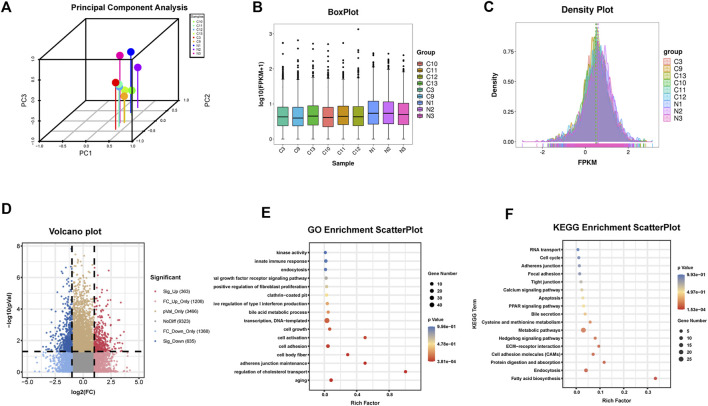
FIGURE 1.
Identification of circRNAs in human HF tissues (A)Principal component analysis (B) Box plot (C) Density plot (D) Differential circRNAs volcano plot. The abscissa is the log2 (Fold Change), and the ordinate is -log10 (p-value). circRNAs with fold changes ≥2 and p-values ≤ 0.05 are indicated as significant up-regulation (E) GO_enrichment_scatterplot of the parental genes of the upregulated circRNAs (F) KEGG_enrichment_scatterplot of the parental genes of the upregulated circRNAs.C represents HF samples (n = 6). N represents control samples (n = 3).

