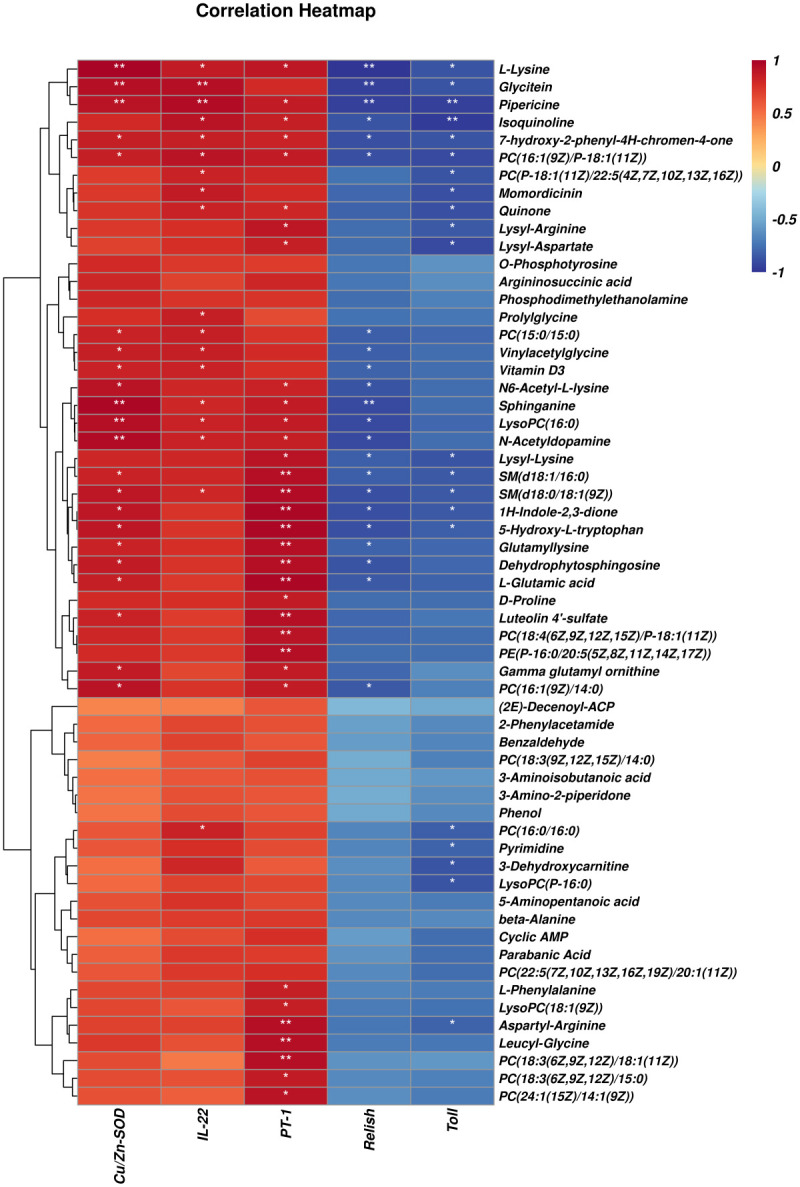
Figure 9.

Correlation analysis of selected differential metabolites and intestinal genes between LF and BC groups. Red represents a positive correlation; blue represents a negative–positive correlation. The darker the color, the stronger the correlation. *p < 0.05, **p< 0.01.
