Figure 8.

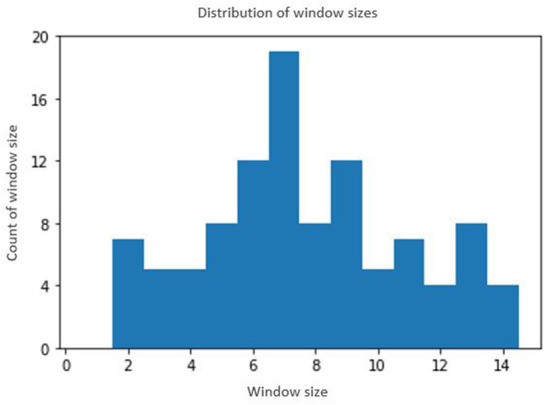
Distribution of window sizes for 118 participants. The x-axis denotes the window size and y-axis denotes the number of participants with the corresponding window size.

Distribution of window sizes for 118 participants. The x-axis denotes the window size and y-axis denotes the number of participants with the corresponding window size.