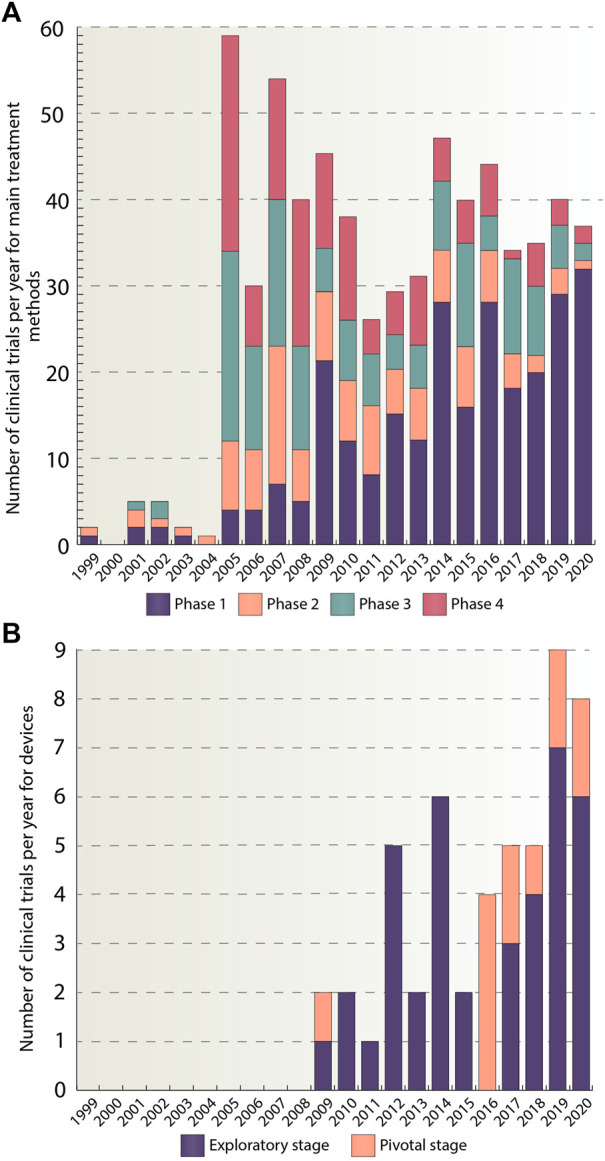
FIGURE 4.

(A) Number of clinical trials per year divided by phases. This figure provides a graphical representation of the number of studies per year for pharmacological, psychological and complementary and alternative methods, categorized by a trial phase for the whole analyzed period (1999–2020). In total, 644 studies were included in the analysis. (B) Number of clinical trials per year divided by stages. For devices, division by stages was used. Stages have been classified as follows: traditional feasibility, first-in-human, and early feasibility stages have been classified as exploratory stage, the pivotal stage has been left as is. This figure shows the number of device studies for the time period from 1999 to 2020. In total, 51 studies were included. The data is due 4 January 2021.
