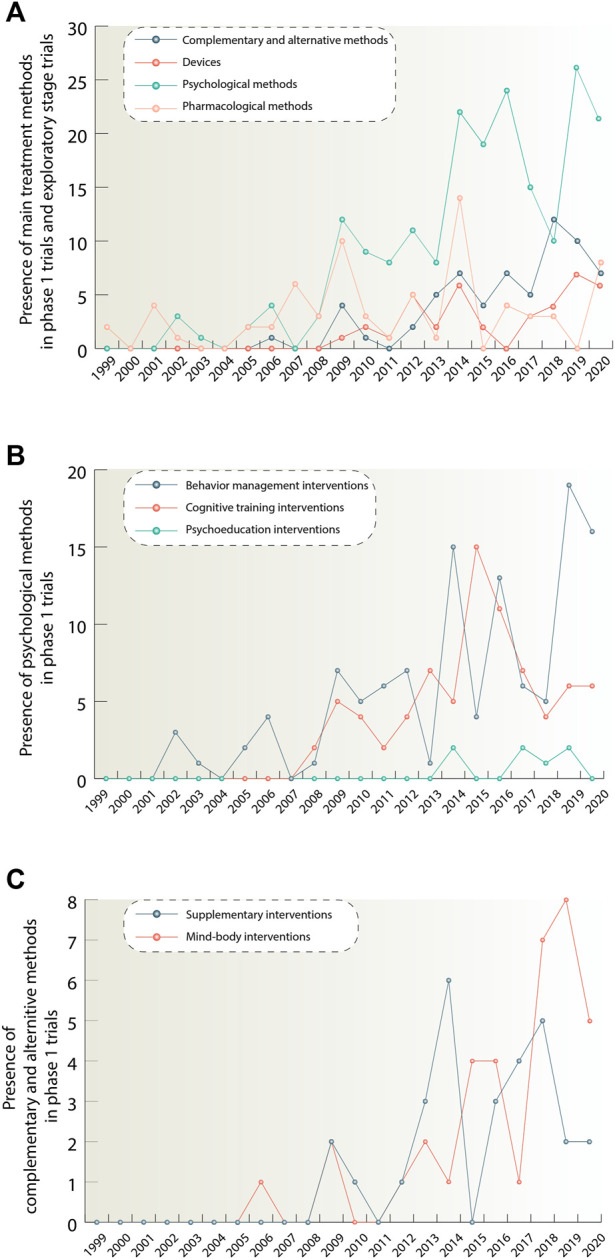
FIGURE 5.

(A) Figure 5A illustrates quantitative trends for pharmacological, psychological, complementary and alternative methods and devices. It shows the number of phase 1 studies per year for each method, exept devices, starting from 1999. In oder to show quantitative trends for the device group, studies in exploratory stage were taken. Traditional feasibility, first-in-human, and early feasibility studies have been classified as exploratory stage studies. If there was a combination of interventions in the study, each intervention in this combination was considered separately. (B) Figure 5B depicts in more detail quantitative trends for the psychological group after its division into smaller subclasses: behavior management, cognitive training and psychoeducation. (C) Figure 5C provides information about quantitative trends distribution for complementary and alternative methods class when divided into supplementary and mind-body intervention groups. The data is due 4 January 2021.
