
Figure 3. Locomotion drives multiple forms of meningeal deformation across distinct time scales.
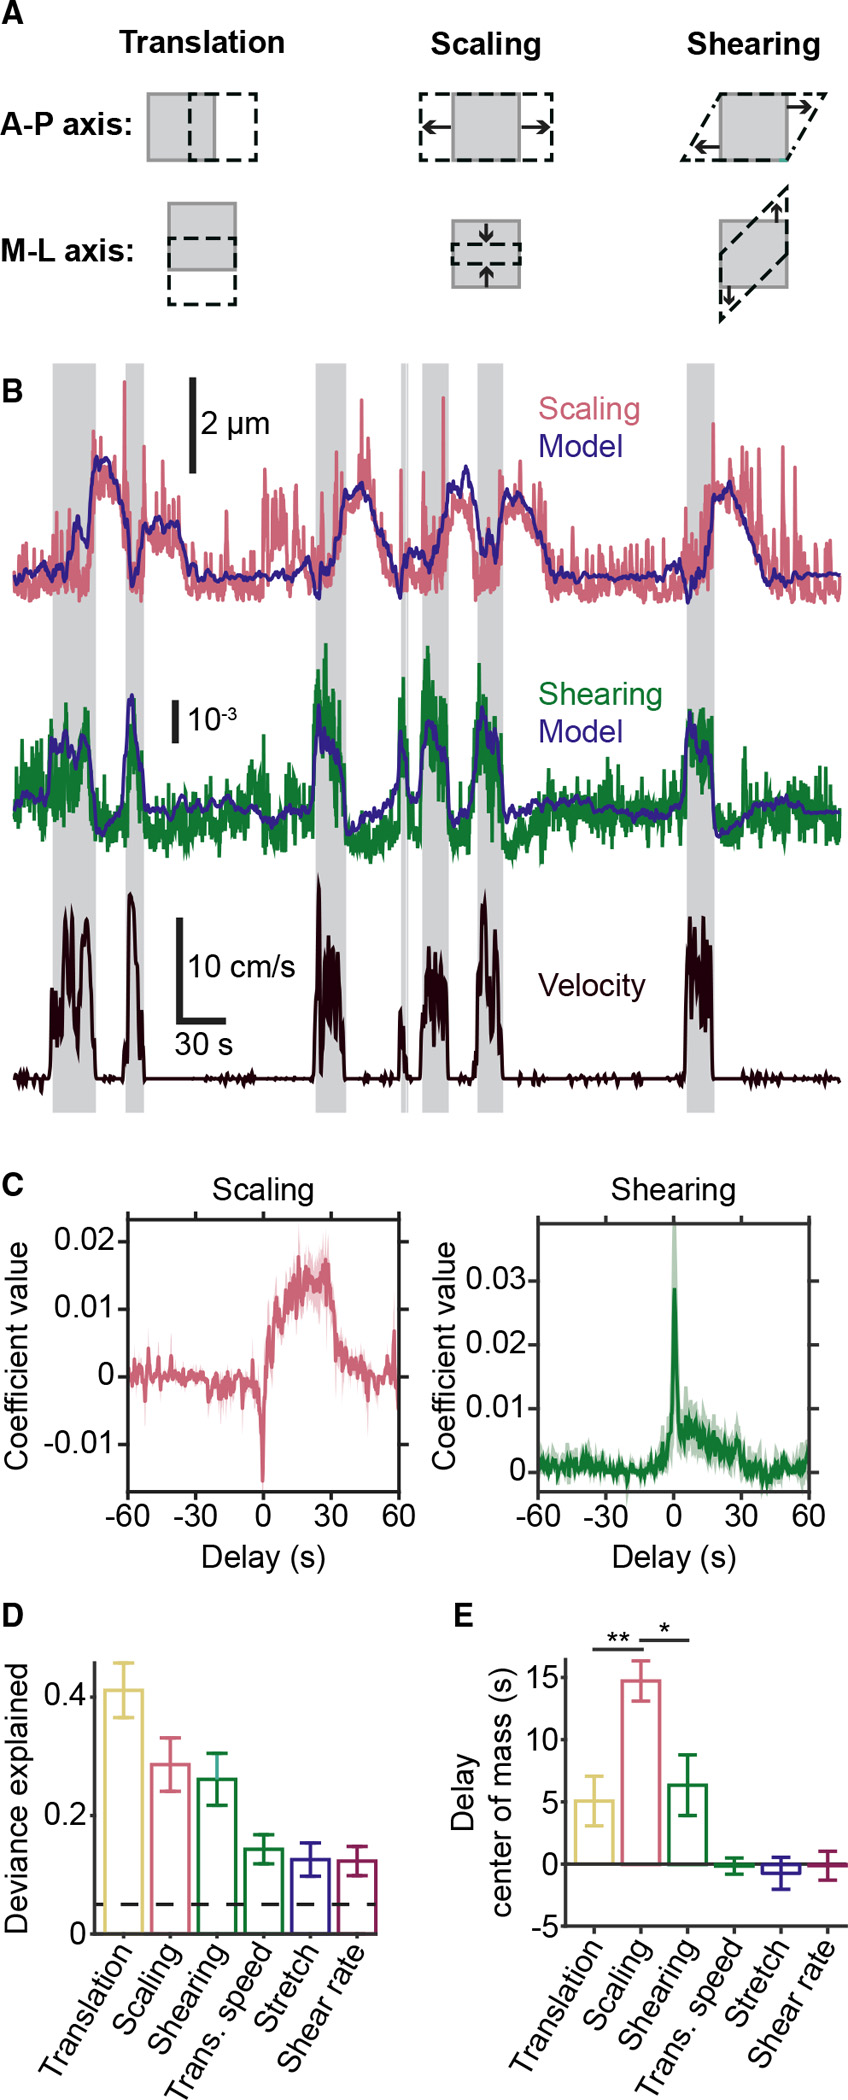
(A) Cartoons illustrating the three types of deformation measured by affine registration. Gray squares represent a FOV before deformation, and the black dashed shapes represent the FOV after deformation. The top row illustrates positive-valued deformations along the anterior-posterior axis, and the bottom row illustrates negative-valued deformations along the medial-lateral axis. Note: scaling deformations include expansion (top middle) or compression (bottom middle).
(B) Example of successful prediction of absolute magnitude of meningeal deformation (scaling and shearing) from a GLM based on locomotion variables. Shaded regions indicate locomotion bouts.
(C) Temporal profiles of GLM coefficients used to predict scaling (left) and shearing (right) from locomotion state. Traces indicate mean across all well-fit FOVs, and shaded regions indicate SEM.
(D) All forms of deformation are consistently well fit by this GLM. Dashed line indicates threshold for being considered well fit.
(E) Center-of-mass (COM) estimates of GLM coefficients across all delays indicate that locomotion drives scaling at a longer delay compared with other forms of meningeal deformation (ANOVA, p = 0.0056; translation versus scaling: **p = 0.0082; scaling versus shearing: *p = 0.0203, post hoc tests). Error bars for (D) and (E) represent mean ± SEM. n = 14 FOV from 6 mice. See also Figure S3.