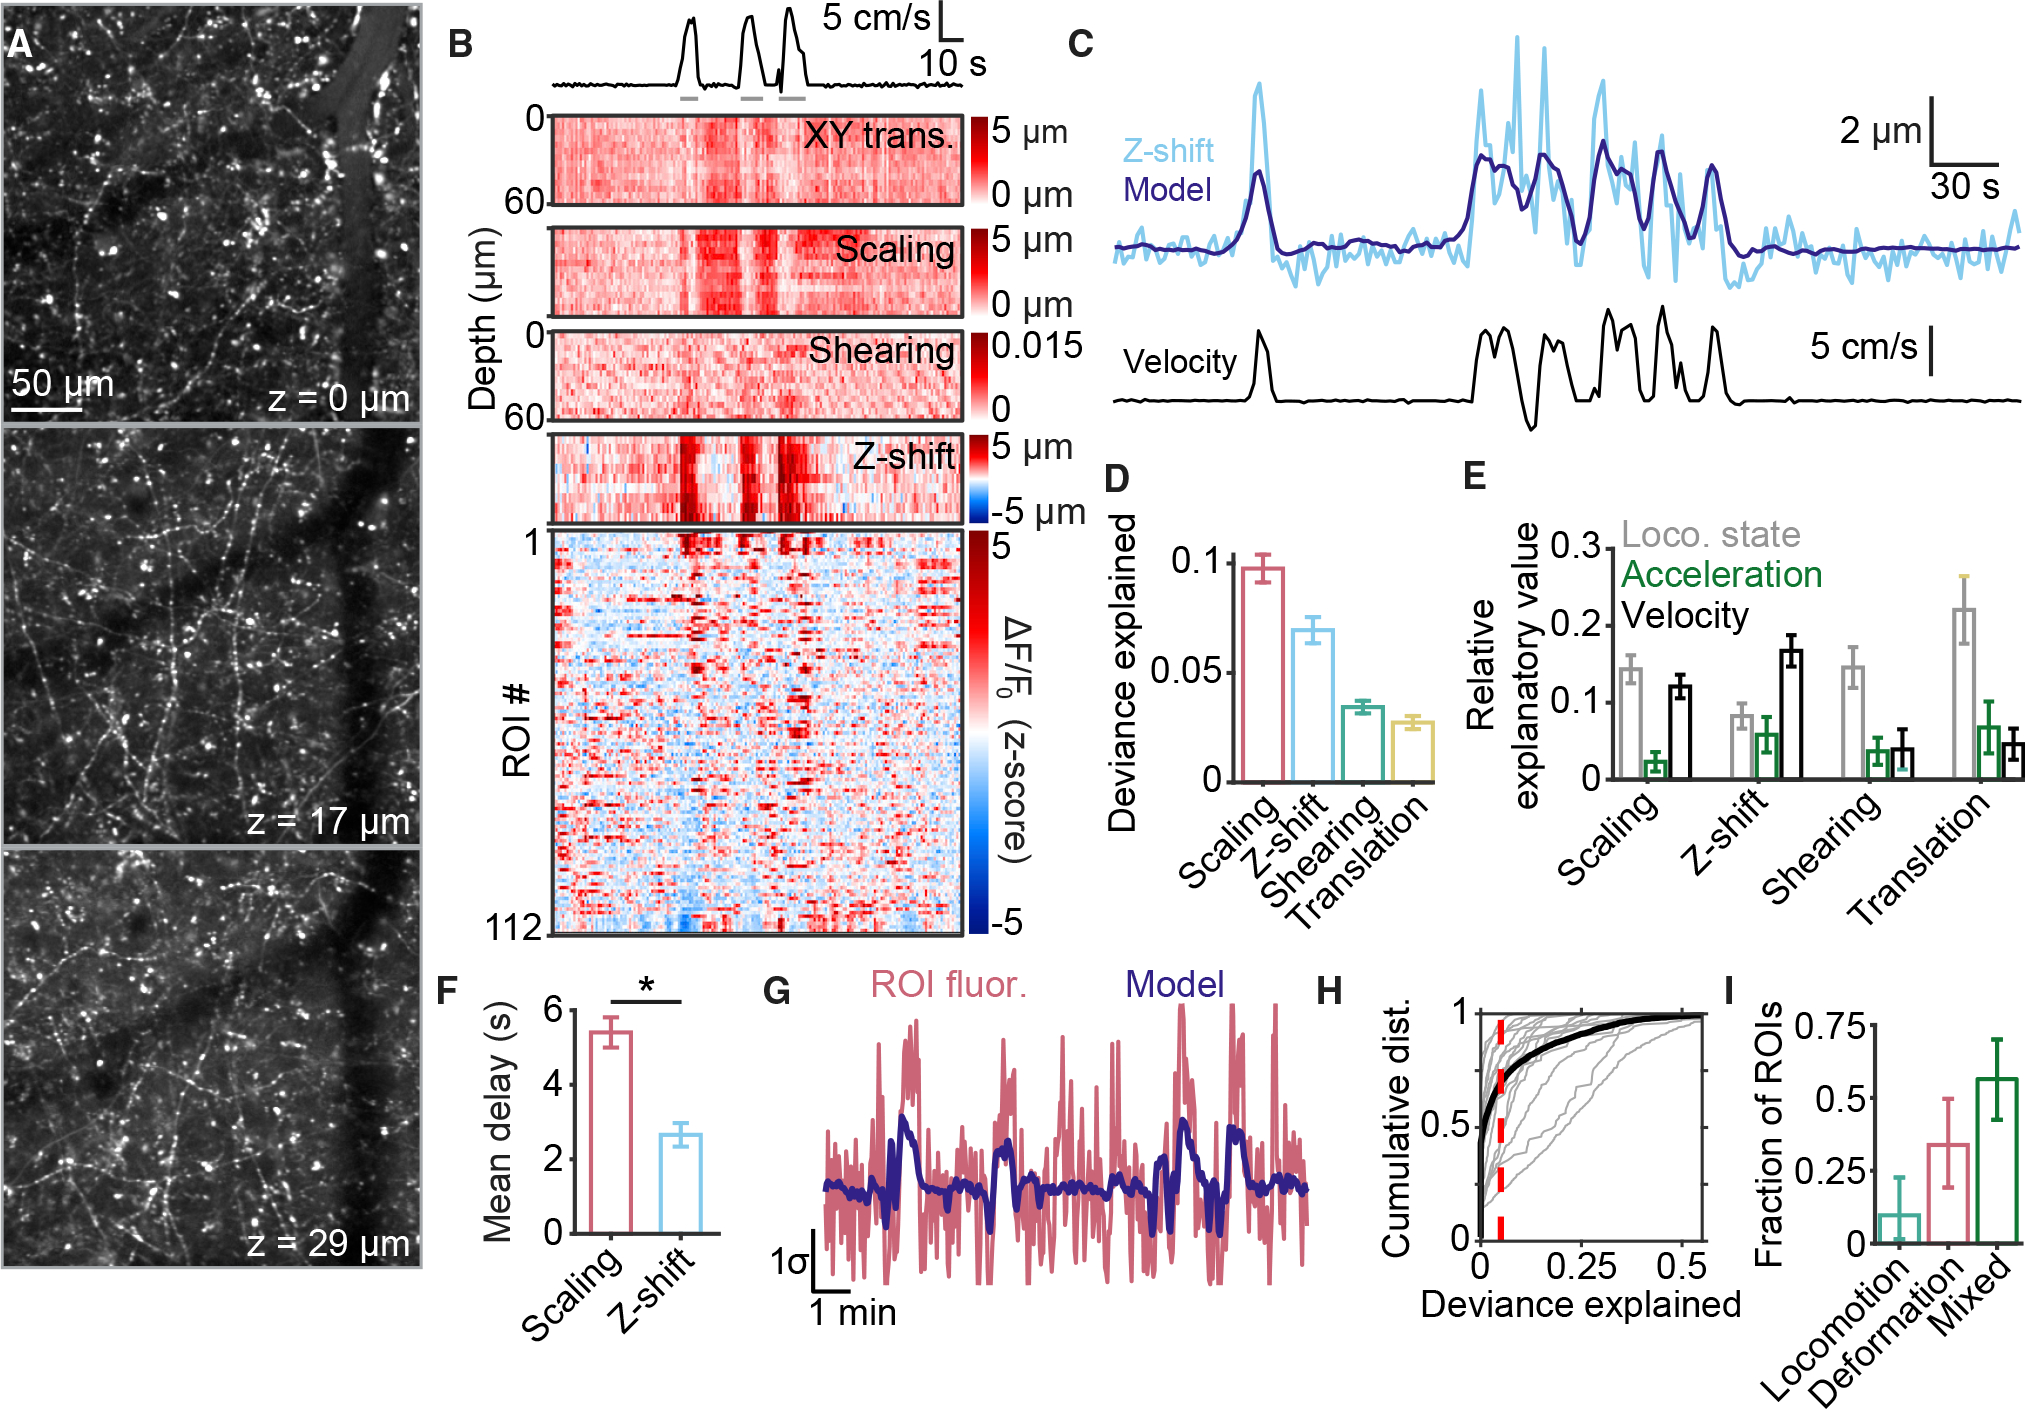
Figure 5. Volumetric imaging of afferent activity and deformation at different depths within the meninges.

(A) Multiple layers of afferents are visible at different depths throughout the thickness of the meninges. Z-values increase with depth relative to the most superficial plane imaged.
(B) Example data showing simultaneous afferent activity (bottom heatmap) and meningeal deformation parameters (top heatmaps) during quiet wakefulness and locomotion (trace at top; gray lines indicate locomotion state).
(C) Comparison of observed z-shift (top, light blue) and the prediction (top, dark blue) of GLM trained on mouse locomotion parameters, including velocity (bottom).
(D) Scaling and z-shift were consistently well fit by a GLM trained on locomotion parameters. Values are mean ± SEM.
(E) Breakdown, for each form of deformation in (D), of the relative explanatory value of each locomotion parameter. Values are mean ± SEM.
(F) GLM coefficients for z-shift were concentrated at earlier temporal delays from locomotion compared with scaling (p = 0.0199, paired t test). Values are mean ± SEM.
(G) Example of a fluorescence trace (red) extracted from a 3D ROI that was well fit by a GLM (dark blue line) based on locomotion and meningeal deformation data.
(H) Cumulative distribution of deviance explained by the GLM for all ROIs from each experiment (gray) and pooled across experiments (black). Dashed line indicates threshold for being considered well fit.
(I) Comparison of the proportions of well-fit ROIs identified as locomotion sensitive, deformation sensitive, or of mixed sensitivity. Values are mean ± 95% confidence interval.
n = 16 FOV from 7 mice for (D)–(F), (H), and (I). See also Figure S6 and Video S3.
