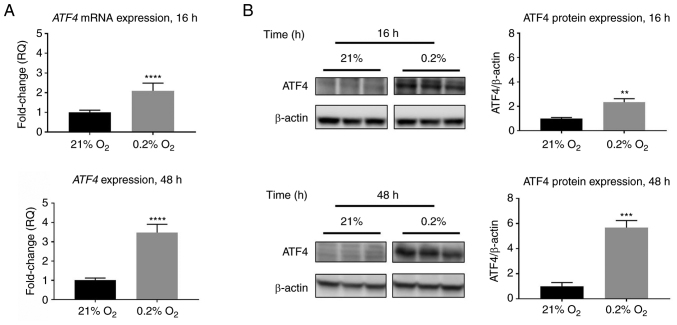
Figure 2.
ATF4 mRNA and protein expression increase in response to acute and chronic hypoxia in PANC-1 cells. PANC-1 cells were treated with hypoxia (0.2% oxygen) or normoxia (21% oxygen) for 16 or 48 h. (A) RT-qPCR was conducted to determine ATF4 mRNA levels. Fold changes for RT-qPCR are shown relative to normoxic cells. Error bars represent the mean ± SD for n=9. The fold changes were analyzed using unpaired Student's t-test. (B) Western blot analysis was conducted to determine ATF4 protein expression levels after 16 or 48 h of hypoxia or normoxia in PANC-1 cells. ATF4 protein levels were normalized to β-actin and are shown relative to normoxic levels. Error bars represent the mean ± SD for n=3. The fold changes were analyzed using unpaired Student's t-test. **P<0.01, ***P<0.001 and ****P<0.0001. ATF4, activating transcription factor 4; RT-qPCR, reverse transcription-quantitative PCR.

