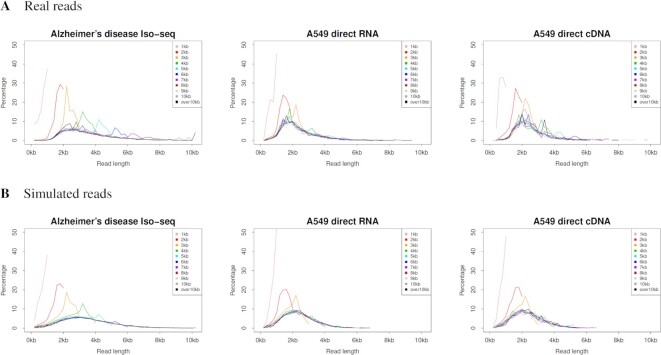
Figure 5.
Read length distribution of TS. Reads were grouped by 1 kb by their template length. Each graph shows the distribution of the read length, where colors of plotted lines represent read groups (e.g. 1 kb refers to a read group with their template accuracy of 1–1000 bp). PacBio Iso-seq (CLR read), ONT direct RNA and ONT direct cDNA were simulated using the PBSIM3 quality score models. The Iso-seq (HiFi read) was generated by ccs software as consensus sequences from PBSIM3 outputs. The template transcript from which each read was most likely sequenced was obtained from alignments between the reads and their reference genomes.

