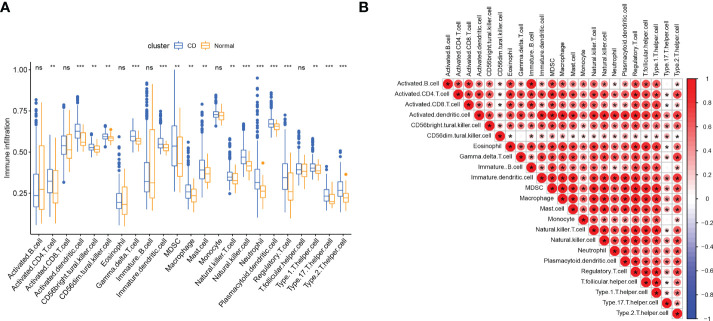
Figure 3.
Immune cell infiltration in patients with CD. (A) Correlation matrix of all 23 types of immune cell subtype compositions. (B) Comparison of 23 immune cell subtypes between patients in CD and controls; The size and color of the circle represent the Pearson correlation coefficients. ns, no significance; * represents p < 0.05, ** represents p < 0.01; *** represents p < 0.001.

