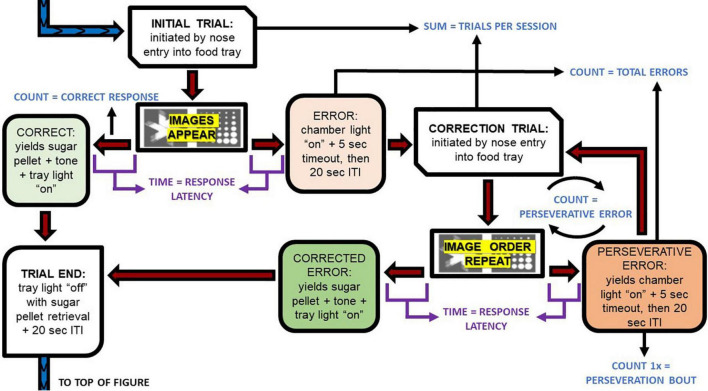
FIGURE 2.
Pairwise discrimination trial progression and dependent variable extractions. This flow chart depicts the execution of the task. The blue and purple font depict the primary dependent variables described in Table 1 and how they were extracted for analyses. ITI, intertrial interval.

