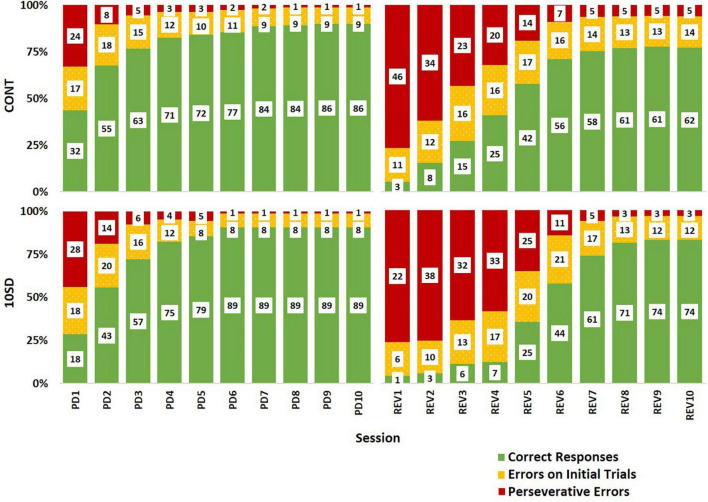
FIGURE 7.
Response type distributions depicting sleep deprivation-induced cognitive rigidity as by evidenced by decelerated adaptive responses in sleep deprived rats following reversal. The control group (CONT) and sleep deprivation group (SD) had similar distributions of response types during the pairwise discrimination training (PD) phase. Both groups had a high proportion of perseverative errors (red) at the beginning of the reversal (REV) phase, but the SD group had a higher proportion of perseverative errors for more sessions. This trend was also observed in the errors on initial trials (yellow) accompanied by fewer correct responses (green). Inset values represent the mean number of responses by type. The height of bars indicates the proportionality of response types relative to each other (summed bar height = 100%).

