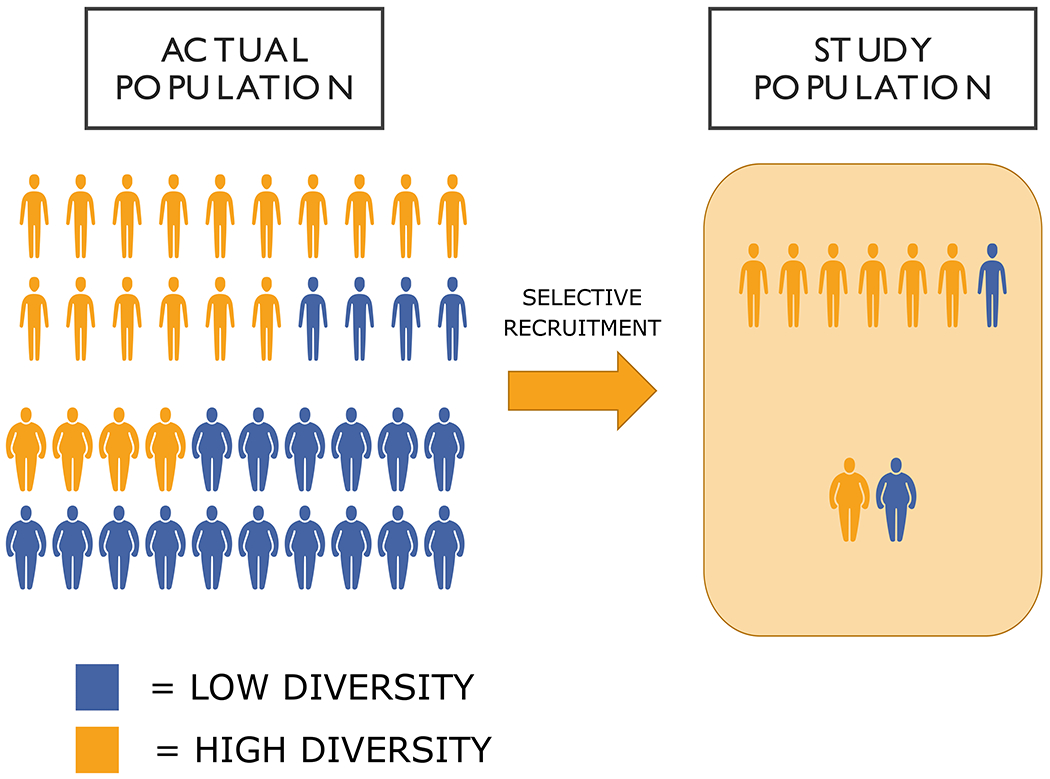
Figure 2:

Implications of selection on SES for obesity-microbiome associations. On the left, the actual population is 30% obese. While the obese population is more likely to have low microbiome diversity, some fraction of obese, likely those of higher SES, will still will have relatively high diversity levels. In a self-selected study sample, which tends to be healthier and higher SES, this can minimize differences between lean and obese individuals on diversity measures. In the actual population, while 80% of lean individuals and 20% of obese individuals will have high diversity, the select study population would be 85% and 50% respectively, thus underestimating the association between obesity and diversity.
