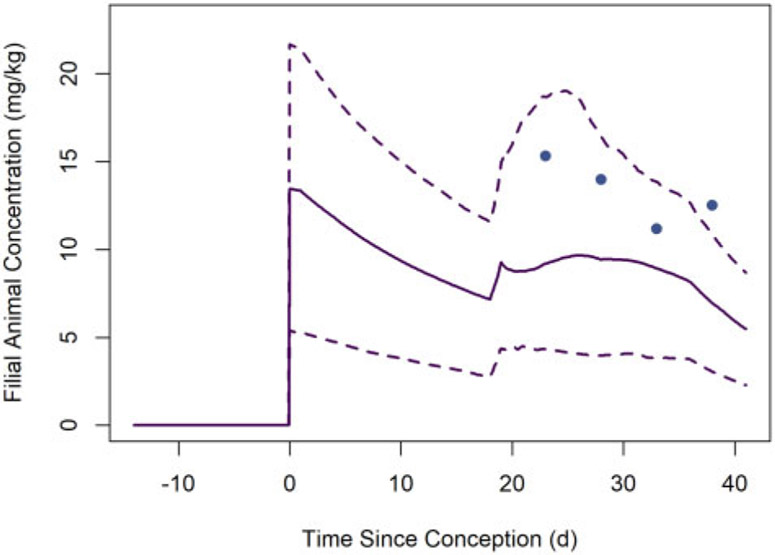
Figure 10.
Whole-body concentrations of PCB 153 in filial animals (mouse pups) observed (solid circles) by Vodicnik and Lech (1980) and estimated (lines) based on model simulations of that study. The solid line represents the median predicted concentrations from the MC simulations, whereas the dashed lines represent the lower and upper bounds of a 95% credible interval for the predicted concentrations.

