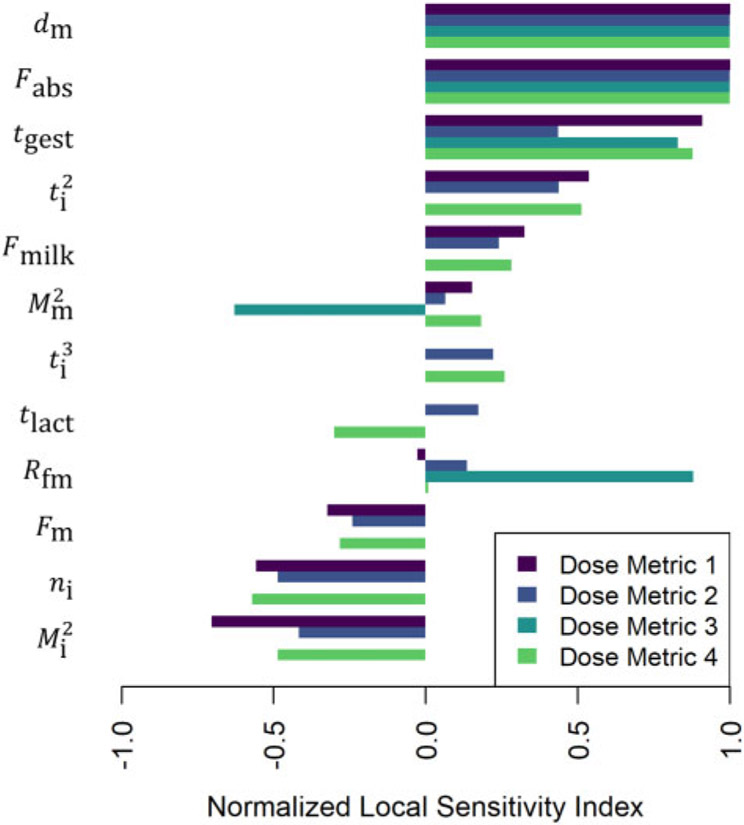
Figure 13.
Normalized sensitivity indices (cf. equation 10) for dose metric 1 (the peak concentration during gestation and the nursing period), dose metric 2 (the average concentration during gestation and the nursing period), dose metric 3 (the average concentration during gestation), and dose metric 4 (the average concentration during the nursing period). These indices represent the ratio of the relative change in the dose metric to the relative change in a single parameter (shown to the left of each group of bars). We computed one sensitivity index per dose metric for each model parameter based on the local set of parameter values described for the model simulation of the Nakashima et al. (1997) study.

