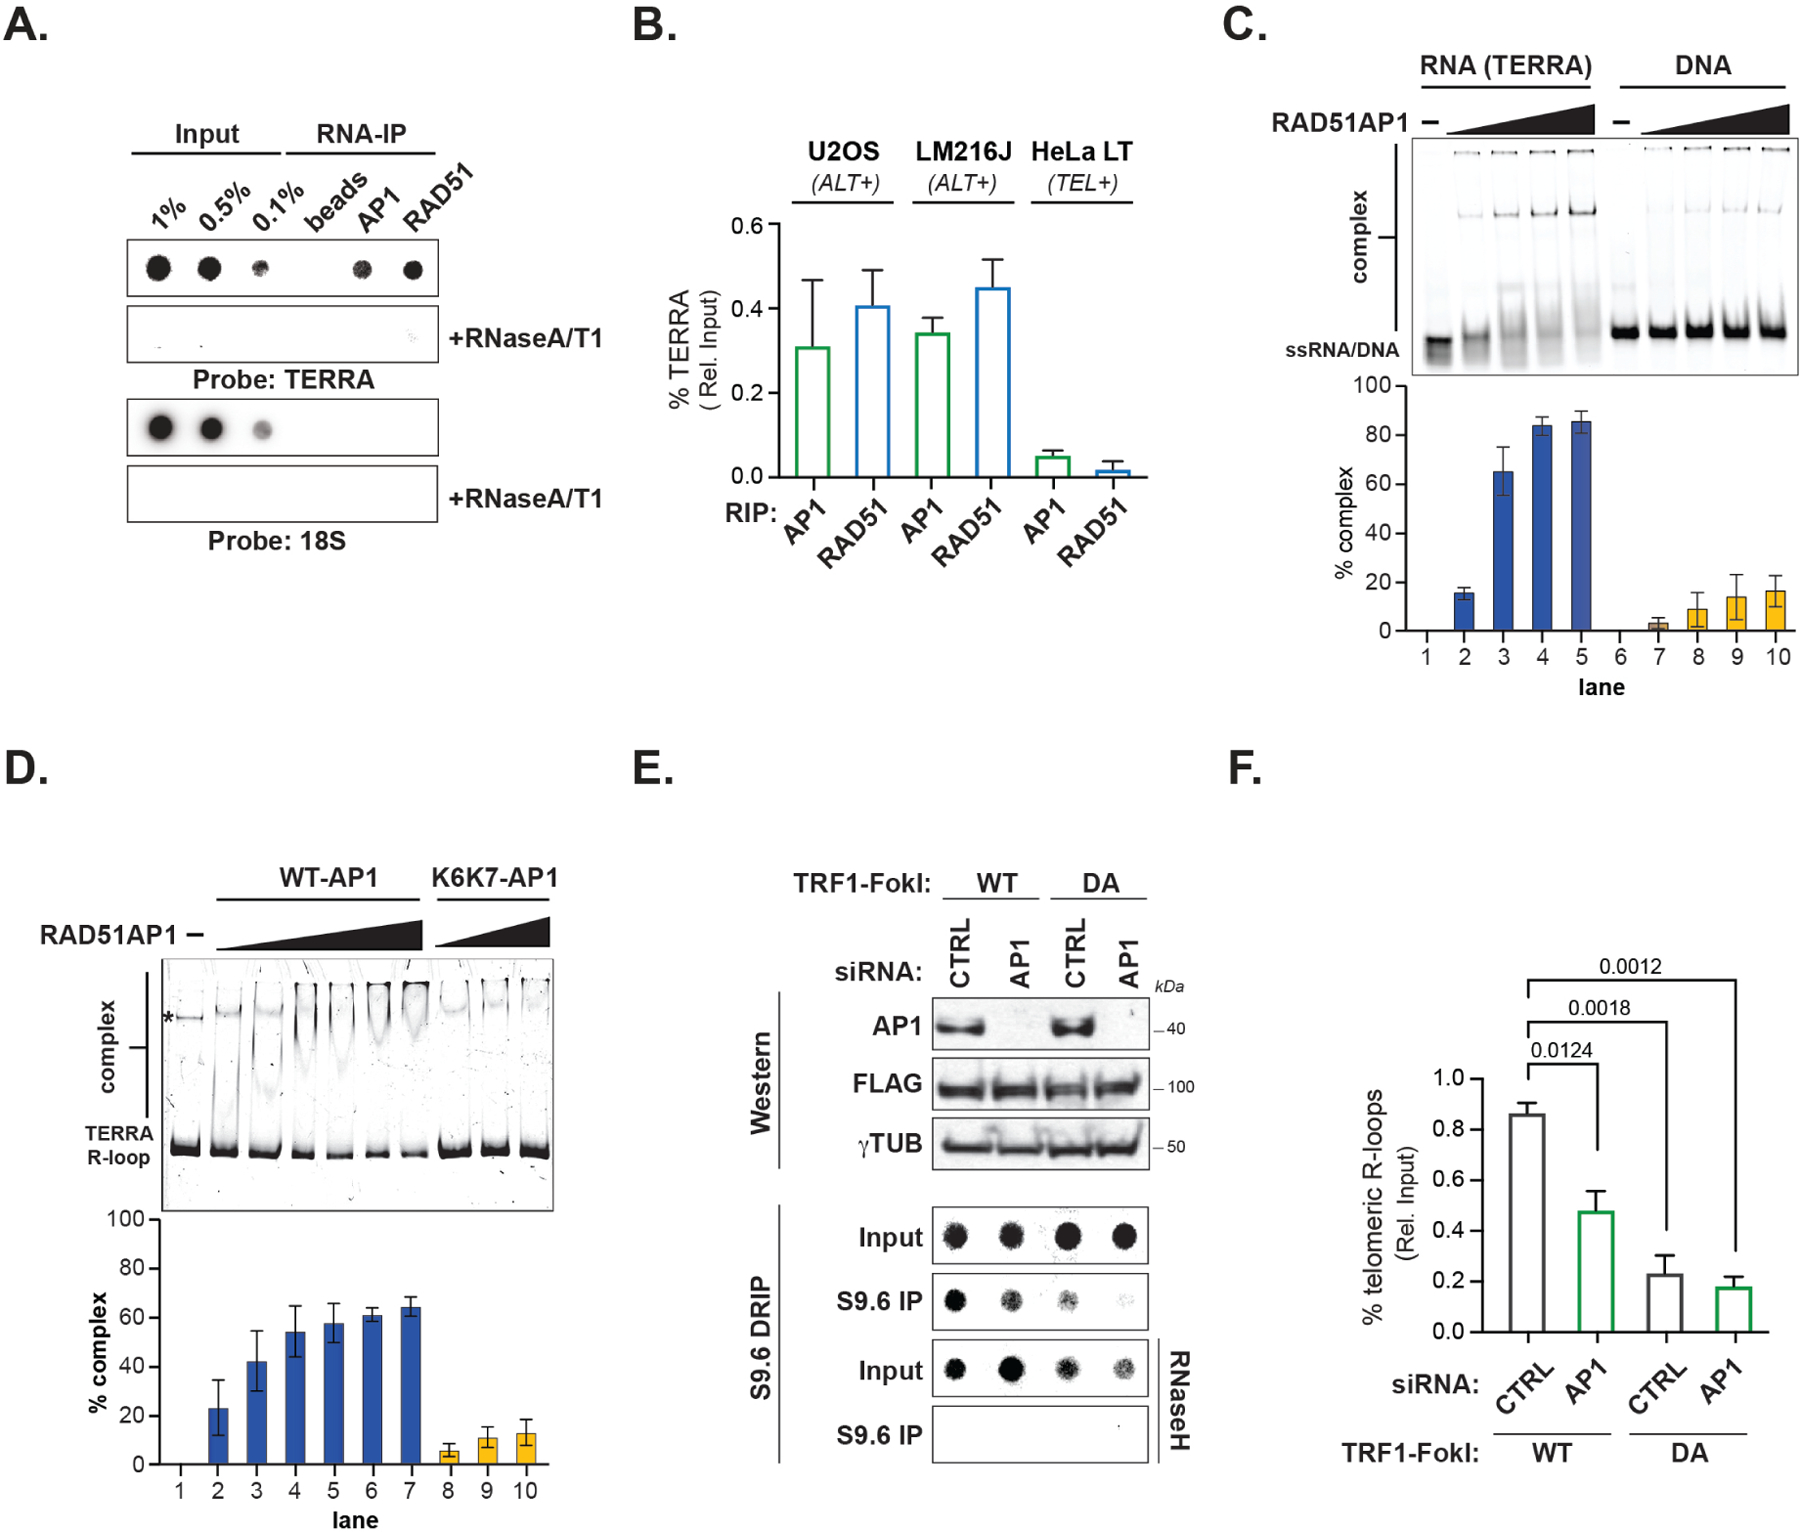
Figure 1. RAD51AP1 binds to TERRA and TERRA R-loops.

(A) Northern dot-blot of TERRA RNA immunoprecipitation (RIP) of endogenous RAD51AP1 and RAD51 in U2OS (n=4) and LM216J (n=2) ALT cells and HeLa LT (n=2) telomerase expressing (TEL+) cells. (B) Quantification of % TERRA detected in RAD51AP1 and RAD51 RIPs. Data represent mean ± SEM. (C) Electromobility Shift Assay (EMSA) of RAD51AP1 binding TERRA RNA (left) and ssDNA oligonucleotides (right) and quantification of shifted nucleic acid substrates. Data represent mean ± S.D, n=3. (D) EMSA of RAD51AP1 WT (left) and K6K7 (nucleic acid binding mutant, right) binding synthetic TERRA R-loops and quantification of shifted R-loop. * indicates a DNA contaminant in the substrate. Data represent mean ± S.D, n=3. (E) Top: Western blots showing RAD51AP1 and FLAG-TRF1-FokI protein levels after RAD51AP1 knockdown in (WT, left)- and (DA, right)- TRF1-FokI induced U2OS cells. Bottom: Southern dot-blot of DNA-RNA immunoprecipitation (DRIP) with S9.6 antibodies after RAD51AP1 knockdown in (WT, left)- and (DA, right)- TRF1-FokI induced U2OS cells. (F) Quantification of telomeric R-loops. Data represent mean ± SEM, n=3. p values are indicated and generated by One way ANOVA. See also Figure S1.
