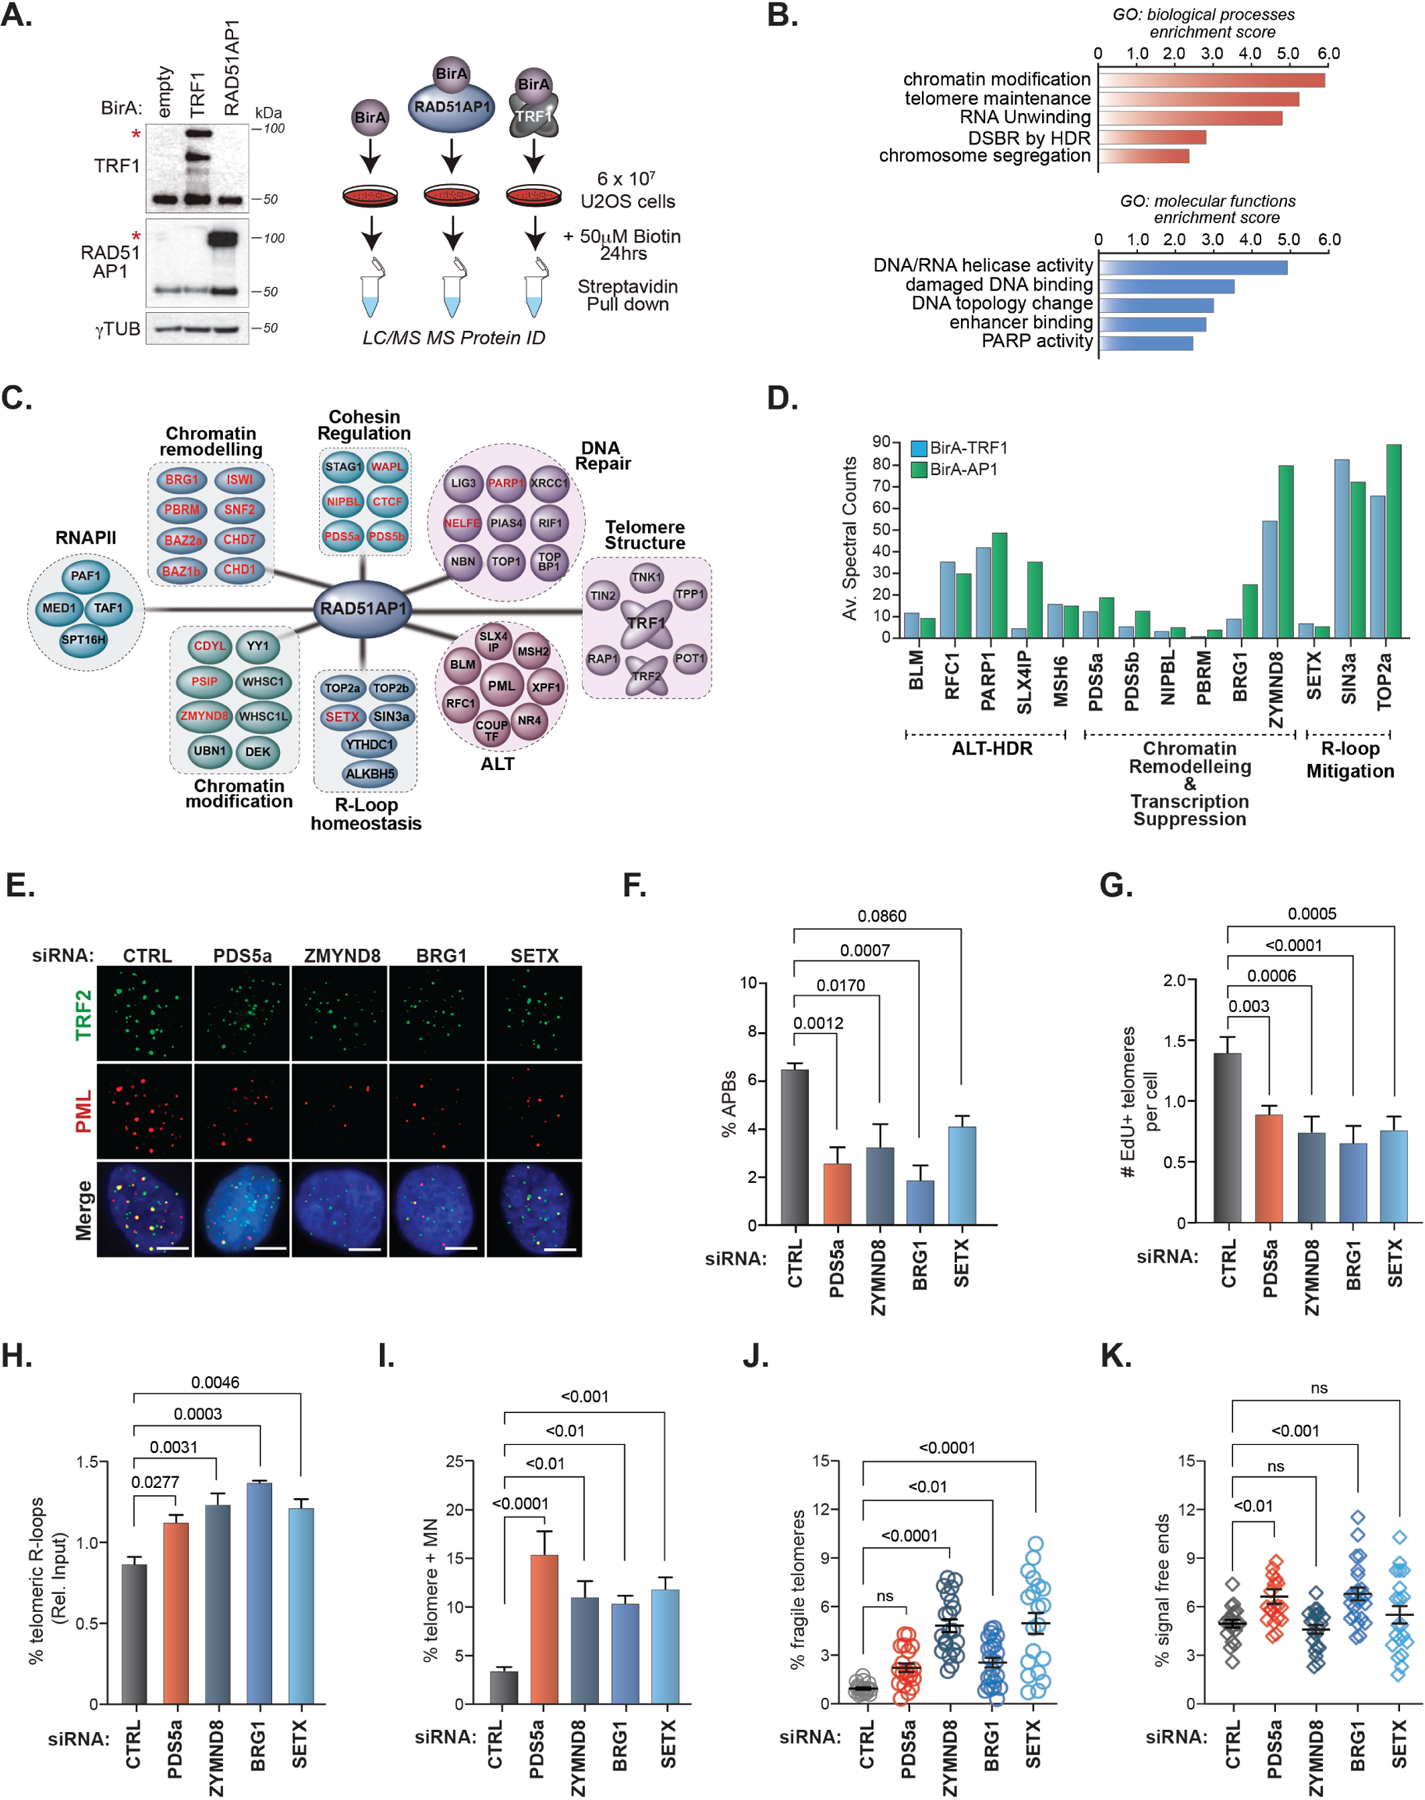
Figure 2. The RAD51AP1 proximal interactome contains RNA processing and transcription-associated complexes.

(A) Right. Schematic of TRF1 and RAD51AP1 BioID. Left. Western blots showing the expression of BirA-TRF1 and BirA-RAD51AP1 in U2OS cells. * indicates the band corresponding to the expected protein. (B) GO-term annotation and ranking of TRF1RAD51AP1 enriched proteins by biological processes and molecular functions using DAVID. (C) Clustering of distinct functional protein groups identified by TRF1-RAD51AP1 BioID. (D) Spectral counts of selected TRF1 (left bars) and RAD51AP1 (right bars) BioID hits from the indicated functional groups. (E) Representative images and (F) quantification of APBs (PML and TRF2 localization) after knockdown of the indicated proteins in U2OS cells. All data represent mean ± SEM, n=3. All scale bars, 5μm. (G) Quantification of telomeres staining positive for EdU incorporation after knockdown of the indicated proteins in U2OS cells synchronized in G2. All data represent mean ± SEM, n=4 (H) Box plot showing the quantification of telomere DRIP assays (n=3). Horizontal lines and boxes represent the mean ± SEM and min-max range of values from individual experiments. (I-K) Quantification of (I) micronuclei with TTAGGG FISH signals (n=2), (J) fragile telomeres (n=2) and (K) signal-free chromosome ends (i.e., telomere loss) (n=2) after knockdown of the indicated proteins in U2OS cells. Each circle in J and K represents a single data point, mean ± SEM are represented by black lines. p values are indicated and generated by One way ANOVA. See also Figures S2, S3 and Table S1.
