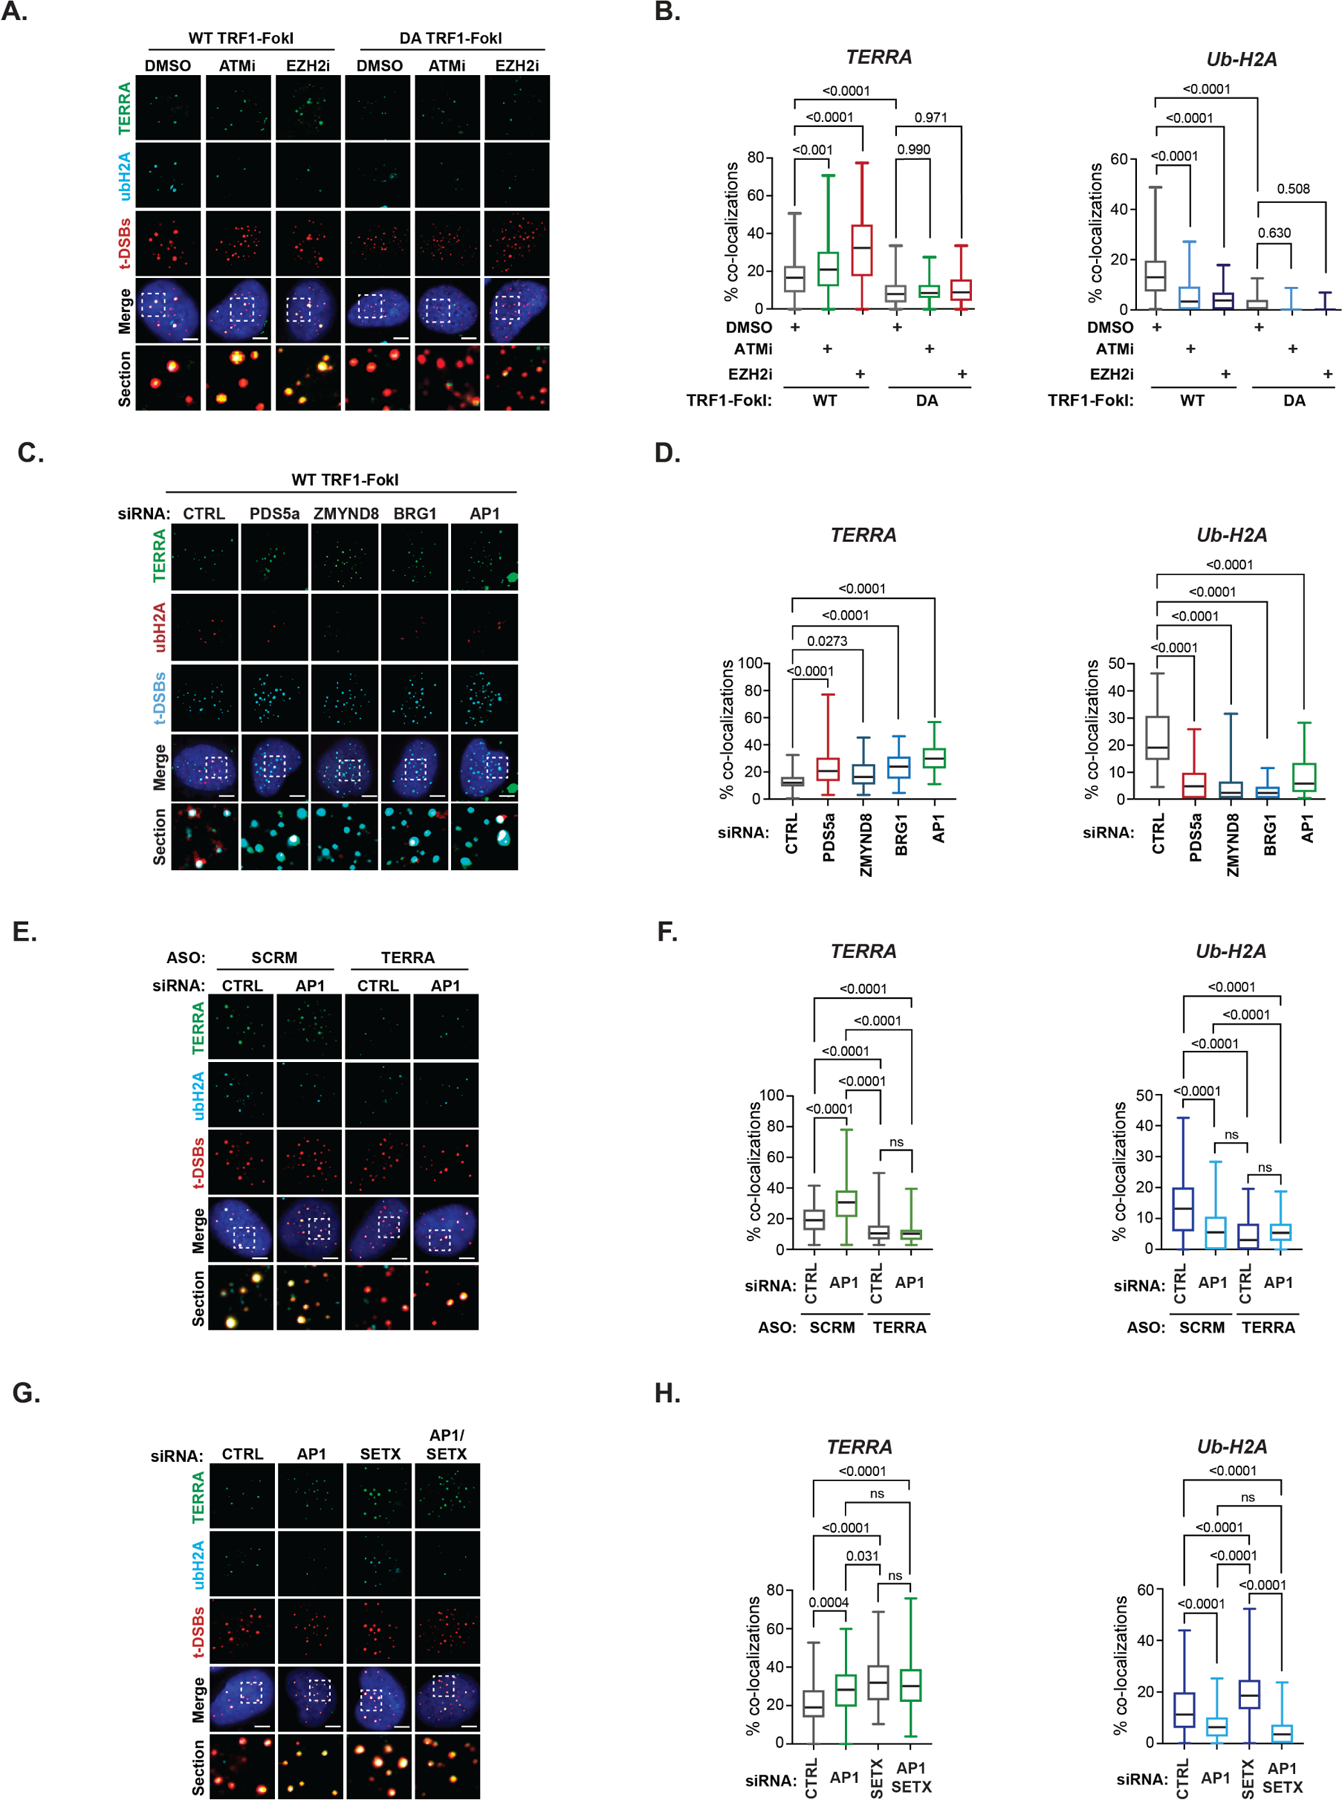
Figure 3. RAD51AP1 co-regulates TERRA suppression during ALT.

(A) Representative images and (B) quantification of TERRA (RNA FISH) and Ubiquitin-K119 of histone H2A (Ub-H2A) (IF) at t-DSBs after ATMi or EZH2i (10μM, 4hrs each). (C) Representative images and (D) quantification of TERRA (RNA-FISH) and ubiquitinated histone H2A-K119 (Ub-H2A) (IF) at telomeric double-strand breaks (t-DSBs generated by FLAG tagged WT-TRF1-FokI) after siRNA-mediated knockdown of indicated proteins. (E) Representative images and (F) quantification of TERRA (left) and Ub-H2A (right) at t-DSBs in scrambled (SCRM) and TERRA ASO depleted U2OS cells that were co-transfected with either control (CTRL) or RAD51AP1 siRNAs. (G) Representative images and (H) quantification of TERRA (left) and Ub-H2A (right) at t-DSBs in U2OS cells that were transfected with either control (CTRL), SETX or/and RAD51AP1 siRNAs. All box and whiskers plots show the interquartile and min-max ranges. The median is represented by the horizontal black line. Data from triplicate independent experiments are shown. p values are indicated and generated by One way ANOVA. All scale bars, 5μm. See also Figure S4.
