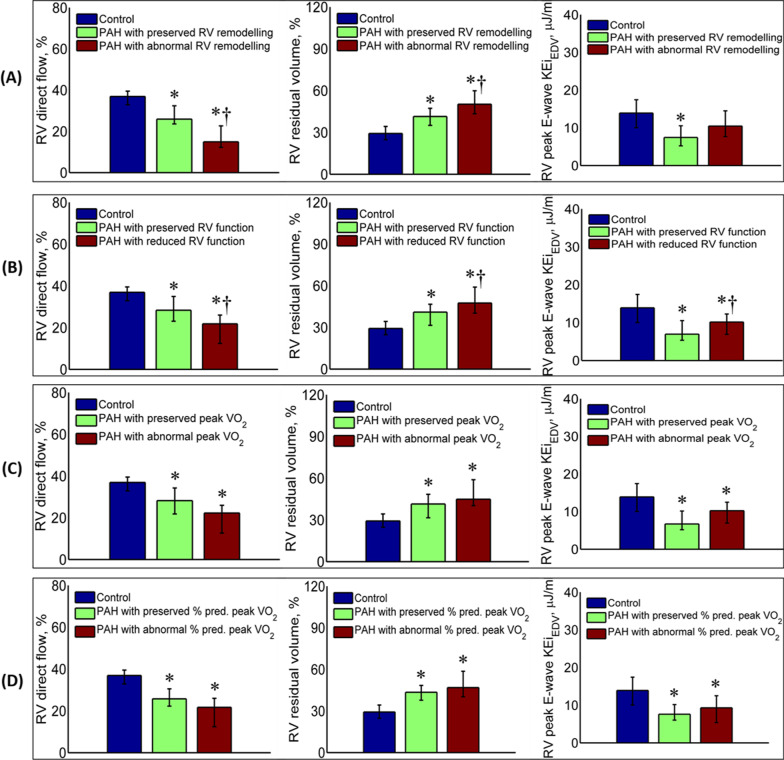
Fig. 3.
Differences in 4D flow right ventricular (RV) parameters according to RV remodelling; RV function; peak oxygen uptake (VO2); and % predicted peak VO2. RV direct flow (left), RV residual volume (middle) and RV peak E-wave KEiEDV (right) are presented A among healthy controls, PAH with preserved RV remodelling (n = 24) and PAH with abnormal RV remodelling (n = 21); B among healthy controls, PAH with preserved RV function (n = 12), and PAH with reduced RV function (n = 33); C among healthy controls, PAH with preserved peak VO2 (n = 10) and PAH with abnormal peak VO2 (n = 35); D among healthy controls, PAH with preserved % predicted peak VO2 (n = 10) and PAH with abnormal % predicted peak VO2 (n = 35). *P < 0.05 compared with healthy controls; †P < 0.05 compared with PAH with preserved RV remodelling, and PAH with preserved RV function, respectively. Error bars denote median—25th percentile (lower) and 75th percentile—median (upper)

