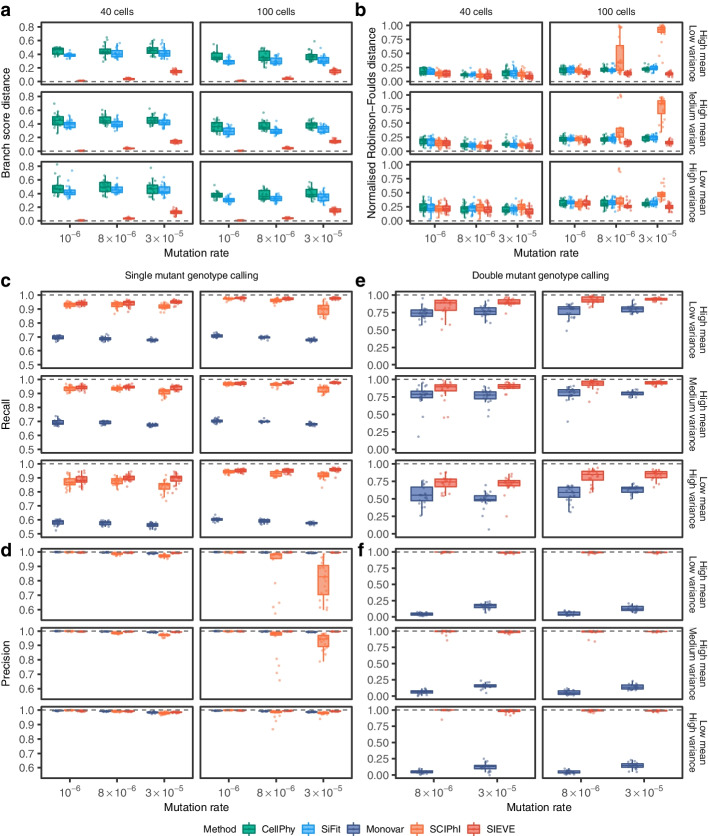
Fig. 2.
Benchmarking result of the SIEVE model. Varying are the number of tumour cells, mutation rate and coverage quality. Each simulation is repeated times with each repetition denoted by coloured dots. The grey dashed lines represent the optimal values of each metric. Box plots comprise medians, boxes covering the interquartile range (IQR), and whiskers extending to 1.5 times the IQR below and above the box. a, b Box plots of the tree inference accuracy measured by the BS distance where the branch lengths are taken into account (a) and the normalised RF distance where only tree topology is considered (b). c, d Box plots of the single mutant genotype calling results measured by the fraction of true positives respectively in the ground truth positives, i.e. the sum of true positives and false negatives, (recall, c) as well as in the predicted positives, i.e. the sum of true positives and false positives, (precision, d). e, f Box plots of the double mutant genotype calling results measured by recall (e) and precision (f), where the variant calling results when mutation rate is are omitted as very few double mutant genotypes are generated (less than 0.1%)

