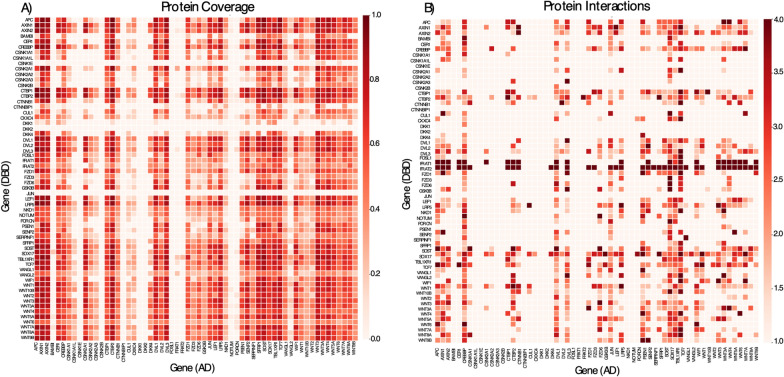
Fig. 2.
Sequence coverage and interaction heat map for Wnt pathway interactome. A amino acid coverage of protein pairs. The 60 clones interrogated in this study are listed alphabetically. A value of 1 indicates 100% sequence coverage (red) for the protein pair, while a value of 0 indicates zero coverage for a given protein pair (light red). B The protein pairs in panel A were tested for interactions by selection in the presence of 3-AT. Interactions were filtered based on Log2FC > 1.5 and FDR < 0.05. A value of 4 indicates a strong interaction with high Log2FC and minimum FDR, whereas a value of 1 indicates no interaction. Proteins paired with AD are represented on the x-axis, while proteins paired with DBD are represented on the y-axis

