Figure 1.

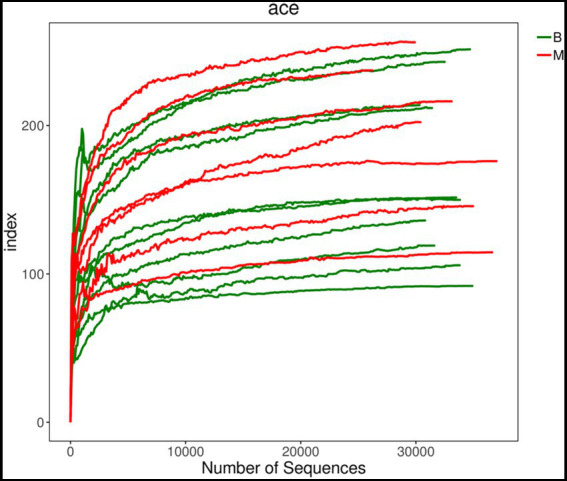
Comparison of α-diversity between Group M and Group B. ACE index dilution curve chart. There was no significant difference in α-diversity between the two groups.

Comparison of α-diversity between Group M and Group B. ACE index dilution curve chart. There was no significant difference in α-diversity between the two groups.