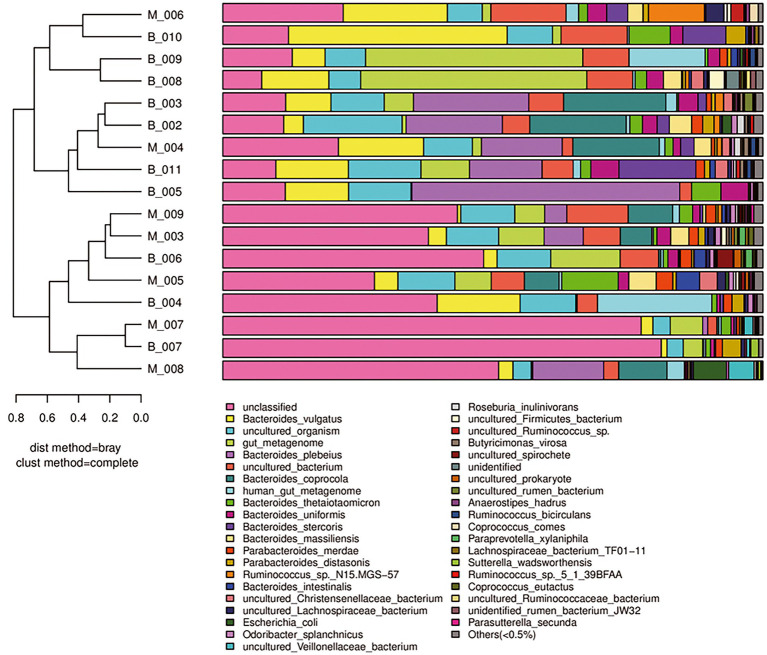
Figure 3.
β-Diversity analysis of Group M and Group B. A sample clustering tree and histogram combination analysis diagram at the species level is shown. The left side shows a hierarchical clustering analysis between samples based on community composition. The two groups of samples show the phenomenon of convergence in the same group. The right side shows a histogram of a community structure of the corresponding samples.

