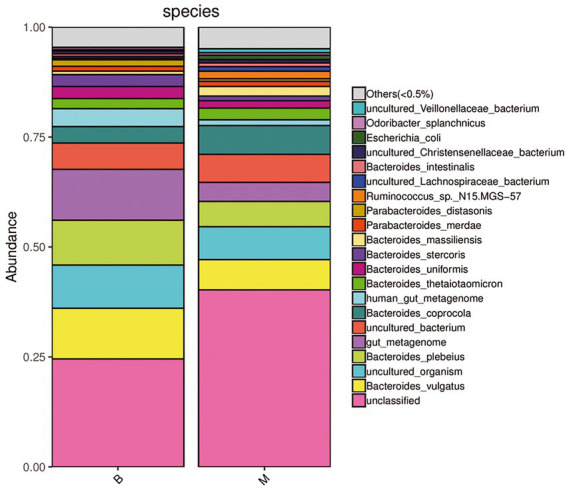
Figure 5.

Histogram of species distribution of bacterial microbiota in Group M and Group B. Species level. Under the existing detection and identification methods, the microbial strain (pink) that could not be annotated in the gut microbiota in Group M was significantly higher than that in Group B. The overall abundance of the dominant bacterial microbiota such as Bacteroides vulgatus (yellow), B. plebeius (light green), B. coprocola (dark green) belonging to Bacteroidetes in Group M was also different from that in Group B.
