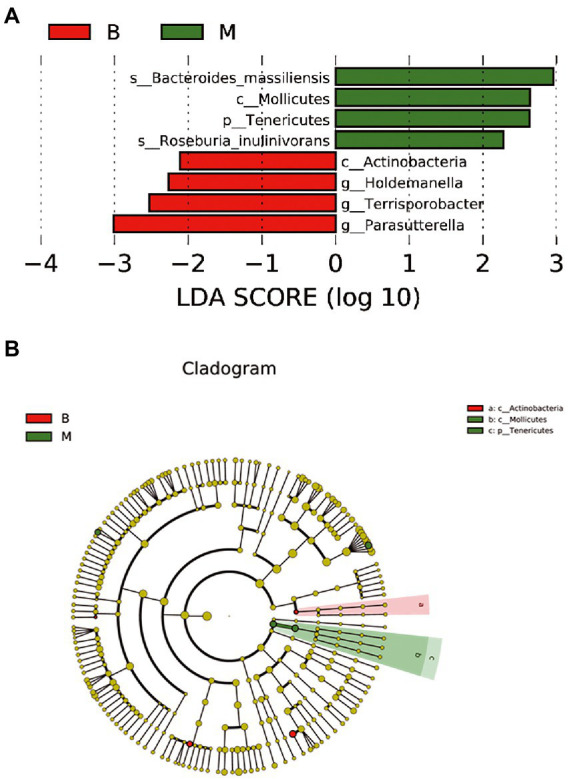
Figure 6.

LDA effect size analysis between Group M and Group B. (A) Microbial species with a significant difference in abundance and a significant effect between the two groups. (B) A clustering tree. The concentric circles from the inside to the outside represent the classification levels of phylum, class, order, family, and genus (or species). The green and red nodes indicate microbial species that played an important role in groups M and B. The diameter of the node circle is proportional to the relative abundance of the taxonomic microbiota, which reflects a significant difference in microbial strains between the two groups and their biological correlation.
